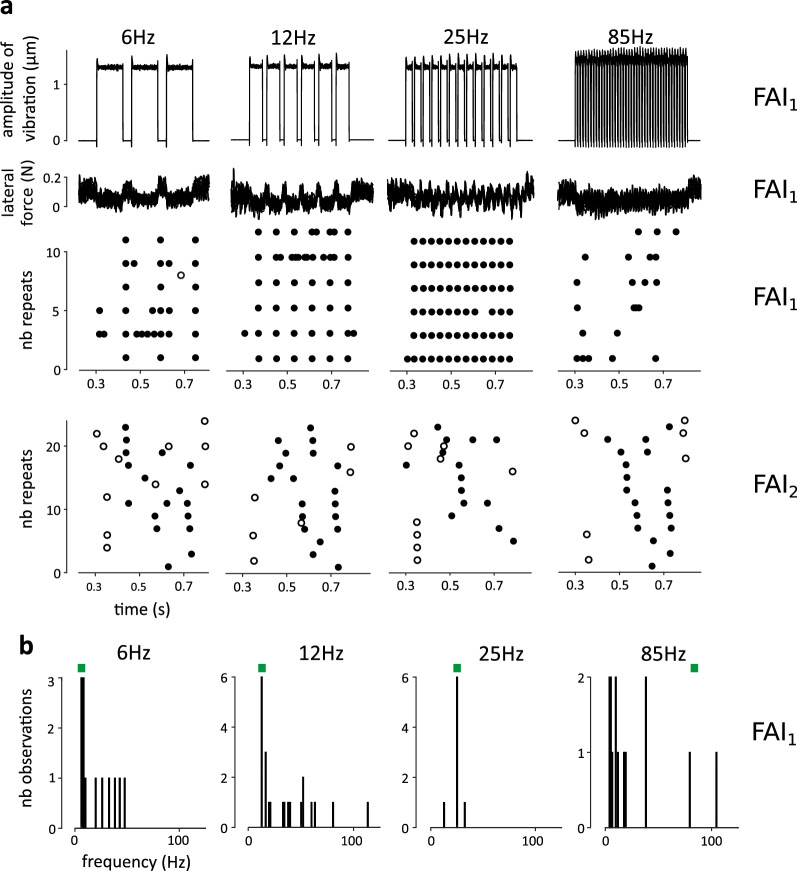
Figure 4.
Gratings. (a) Profiles of ultrasonic vibration, profiles of lateral force, and the corresponding raster plots are shown for FAI1 at four distinct frequencies of stimulation: 6, 12, 25 and 85 Hz. Filled/unfilled dots indicate ulnar/radial direction of sliding. Firing followed the frequency of stimulation in a time-locked fashion between 6 to 50 Hz for this unit. Raster plots are also shown for FAI2 at the same frequencies, where there was no frequency following. (b) Histogram of firing frequencies obtained for each condition are shown for FAI1.

