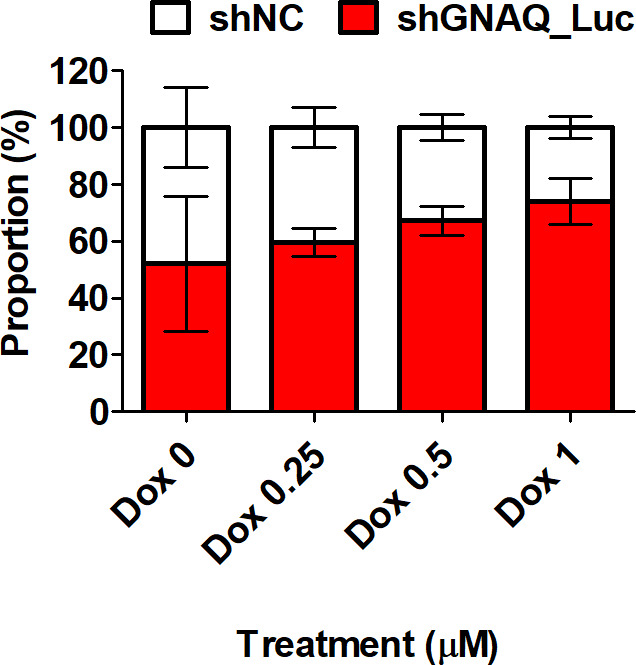
Fig. 5.

The corresponding graph for Figure 3e: proportion of cells in response to treatment with doxorubicin. Control and stably luciferase-expressing G protein subunit alpha Q (GNAQ)-knockdown cells were 1:1 co-cultured and treated with doxorubicin at concentrations ranging from 0.25 μM to 1 μM for 72 hours. shNC, negative control short hairpin RNA.
