
Figure 2.
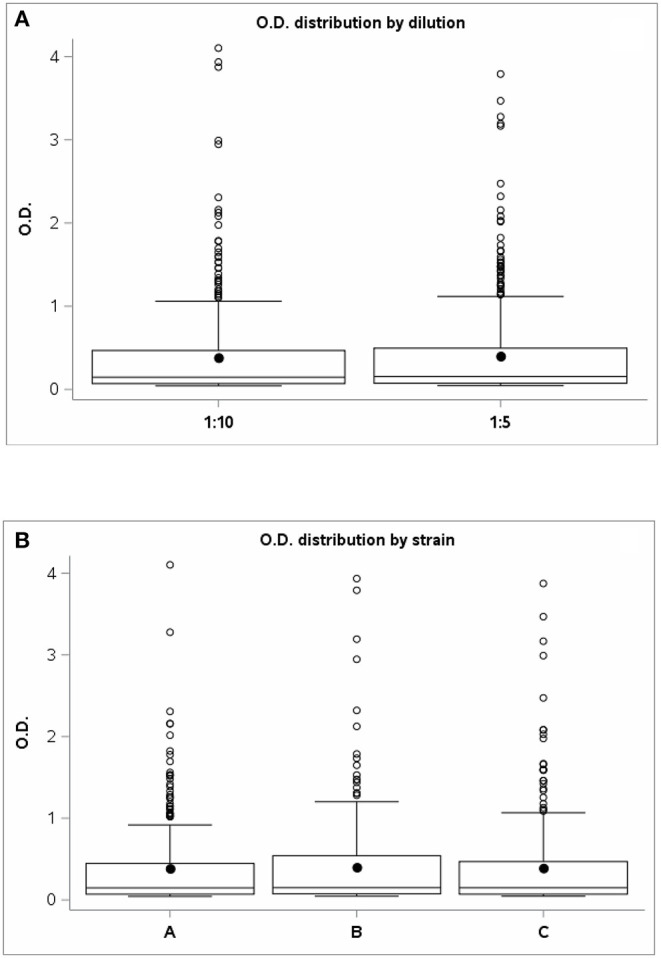
The graph shows the OD values distribution of PPD Johnins (A) for the two dilutions: 1:5 and 1:10 and (B) for strains A, B, and C. OD, optical density; PPD, purified protein derivative.
Official websites use .gov
A
.gov website belongs to an official
government organization in the United States.
Secure .gov websites use HTTPS
A lock (
) or https:// means you've safely
connected to the .gov website. Share sensitive
information only on official, secure websites.
The graph shows the OD values distribution of PPD Johnins (A) for the two dilutions: 1:5 and 1:10 and (B) for strains A, B, and C. OD, optical density; PPD, purified protein derivative.