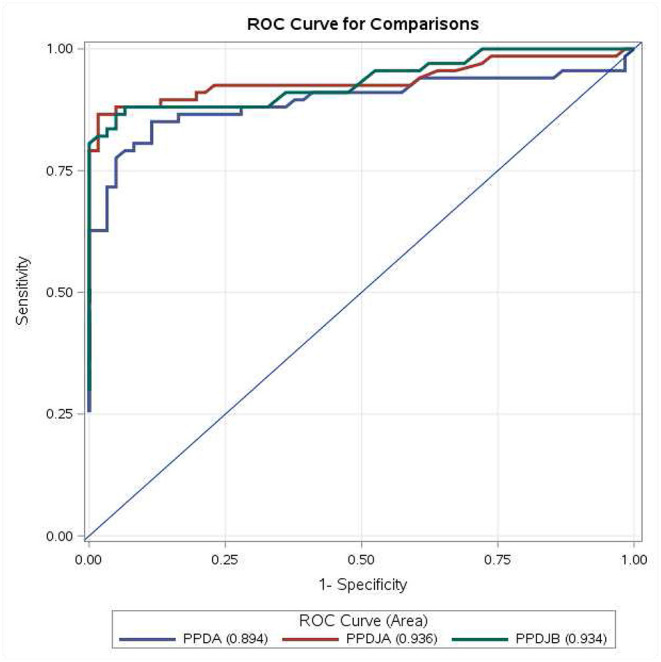
Figure 3.

ROC curve for comparisons of PPDA-PBS, PPDJA-PBS, and PPDJB-PBS according to the first three interpretative criteria of the IFN-γ test applied in the study for the diagnosis of Mycobacterium avium subsp. paratuberculosis (MAP)-infected cattle. PPDJA and PPDJB showed higher AUC than PPDA, and the difference is statistically significant (p < 0.05). ROC, receiver operating characteristic; IFN, interferon; PPD, purified protein derivative; PPDA, avian PPD; PPDJA, PPD Johnin strain A; PPDJB, PPD Johnin strain B; AUC, area under the ROC curve.
