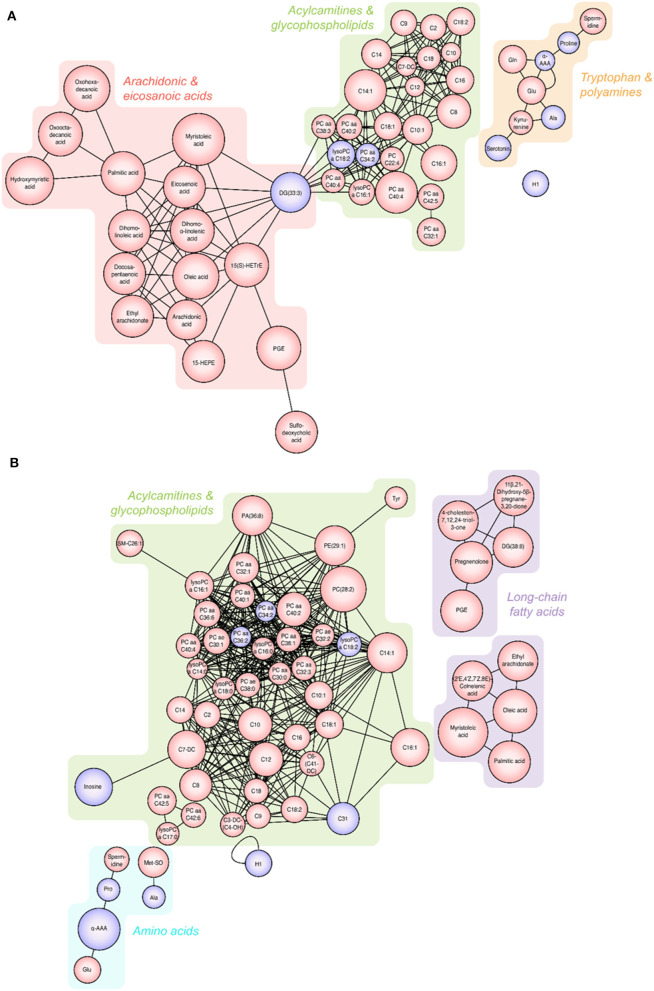
Figure 3.
Changes in metabolites seen in patients with T-COPD and S-COPD. (A) Significantly altered metabolites were observed between the NC and T-COPD groups. (B) Significantly altered metabolites were observed between the NC and S-COPD groups. The size of the circle indicates the relative fold change compared to the NC group. The red circle represents increased levels and the purple circle represents decreased levels of metabolites in patients, compared to healthy controls. NC, normal control; T-COPD, TB-associated COPD; S-COPD, smoking-associated COPD.

