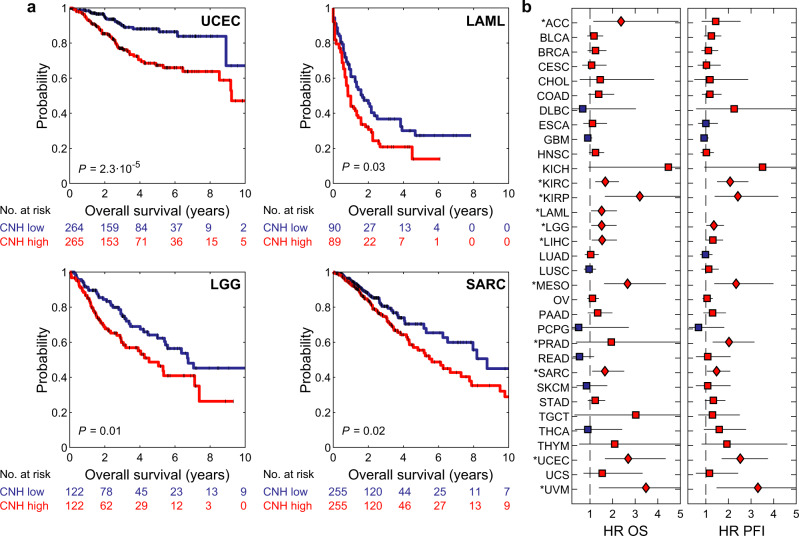
Fig. 4. CNH is prognostic for survival in most types of cancer.
a Kaplan–Meier plots of overall survival for uterine corpus endometrial cancer (UCEC), sarcoma (SARC), low-grade glioma (LGG) and acute myeloid leukaemia (LAML). The homogeneous (blue lines) and heterogeneous (red lines) groups were compared by the two-sided log-rank test. b Hazard ratios (HR) of copy number heterogeneity (CNH) for overall survival (OS, left panel) and progression-free interval (PFI, right panel) of all 33 cancer types in TCGA. Hazard ratios were calculated using univariate Cox proportional-hazard models. Red (blue) symbol indicates that the CNH-high (low) group has poorer survival. Significance is indicated by diamonds and marked with an asterisk per type. Error bars represent 95% confidence intervals of hazard ratios as given by the two-sided Wald test. Patients are split in two groups of equal size based on rank-ordered CNH in these survival analyses. Source data are provided as a Source Data file.

