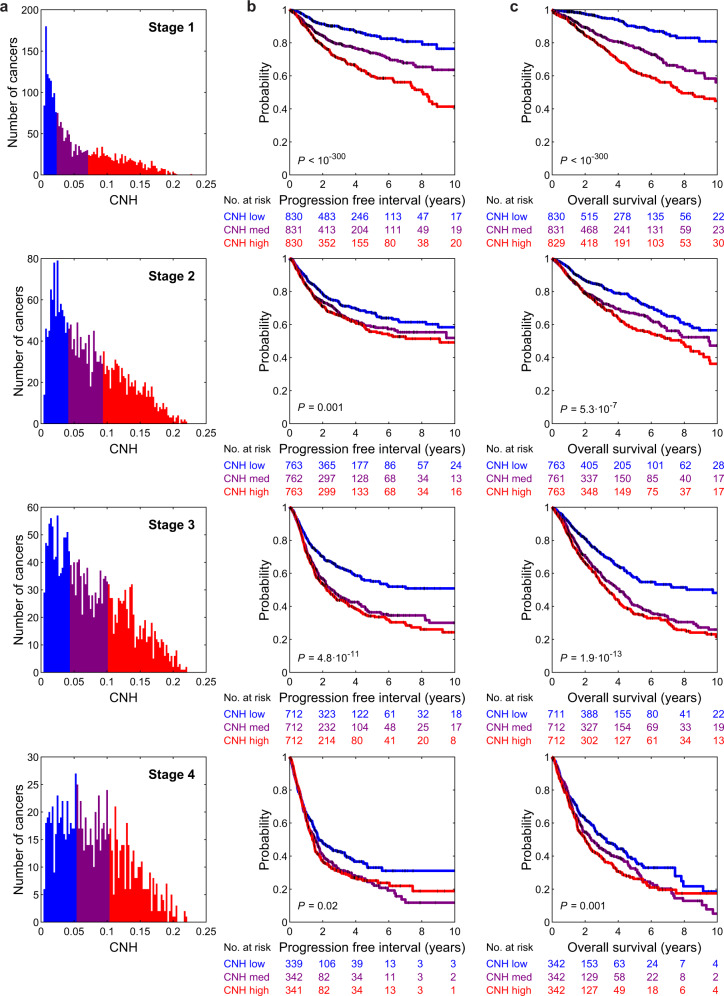
Fig. 7. CNH increases with stage and is predictive within each stage.
a Distribution of copy number heterogeneity (CNH) per stage, for 7792 primary cancers in TCGA with known stage and copy number data. Kaplan–Meier plots of progression-free interval (b) and overall survival (c). Per stage, patients are split into three groups of equal size based on rank-ordered CNH in the survival analysis. The most homogeneous (blue) and most heterogeneous (red) groups are compared by the two-sided log-rank test. Source data are provided as a Source Data file.

