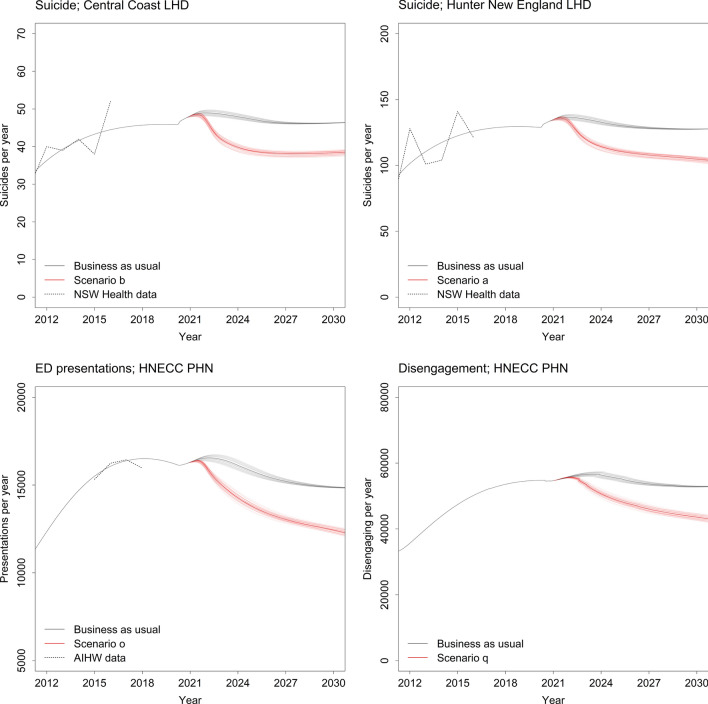
Figure 2.
Numbers of suicides, emergency department (ED) presentations, and patients disengaging from services per year under the baseline scenario (i.e., business as usual) and the optimal intervention scenario for each outcome (see Table 2 for intervention scenario details). The dotted lines show estimates of numbers of suicides and ED presentations published by NSW Health (http://www.healthstats.nsw.gov.au) and the Australian Institute of Health and Welfare (2019). Model outputs from the sensitivity analyses, incorporating uncertainty in the intervention effects and the duration of increased distress onset due to the COVID-19 pandemic, are shown as lighter solid lines; the heavier solid lines show model outputs obtained assuming the default parameter values.

