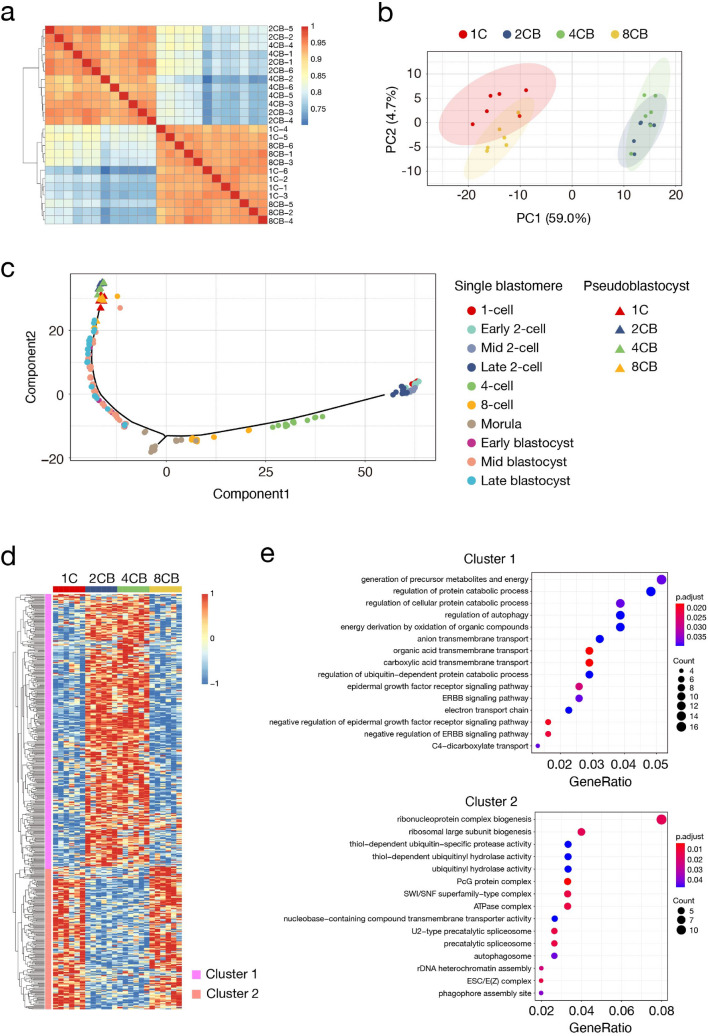
Figure 4.
Transcriptomic analysis of pseudoblastocysts derived from single blastomeres. (a) Heat map for hierarchical clustering of Pearson’s correlations for 1C, 2CB, 4CB, and 8CB pseudoblastocysts (96 hpi) according to their gene expression profiles. Samples were clustered on the basis of their pairwise correlations. The color scale shows Pearson’s correlation coefficient. The image was created with the use of pheatmap version 1.0.12 (https://CRAN.R-project.org/package=pheatmap). All RNA-seq data were obtained by a single sequencing run and were then analyzed. (b) PCA analysis of the transcriptomes of 1C, 2CB, 4CB, and 8CB pseudoblastocysts (96 hpi). Shaded ellipses represent the 95% CI for blastomere stage. The image was created with the use of ggplot2 version 3.3.272 (https://ggplot2.tidyverse.org). (c) Pseudotime trajectory analysis for the transcriptomes of 1C, 2CB, 4CB, and 8CB pseudoblastocysts (96 hpi) and for those of single blastomeres of preimplantation embryos at the indicated stages27 conducted with the use of Monocle273. The image was created with the use of ggplot2 version 3.3.272 (https://ggplot2.tidyverse.org). (d) Heat map showing relative expression patterns for the top 500 genes with the largest variance among 1C, 2CB, 4CB, and 8CB pseudoblastocysts (96 hpi) identified by DESeq2 (P < 0.01). The color scale shows the z-score. The image was created with the use of pheatmap version 1.0.12 (https://CRAN.R-project.org/package=pheatmap). (e) GO terms enriched in clusters 1 or 2 in (d). GO analysis was performed with the use of clusterProfiler version 3.10.074. Count represents the number of differential genes related to the GO term. p.adjust represents the adjusted P value. GeneRatio represents the number of genes related to the GO term among the differentially expressed genes as a proportion of the total number of differentially expressed genes. The image was created with the use of clusterProfiler verion. 3.10.074 (https://guangchuangyu.github.io/software/clusterProfiler/).

