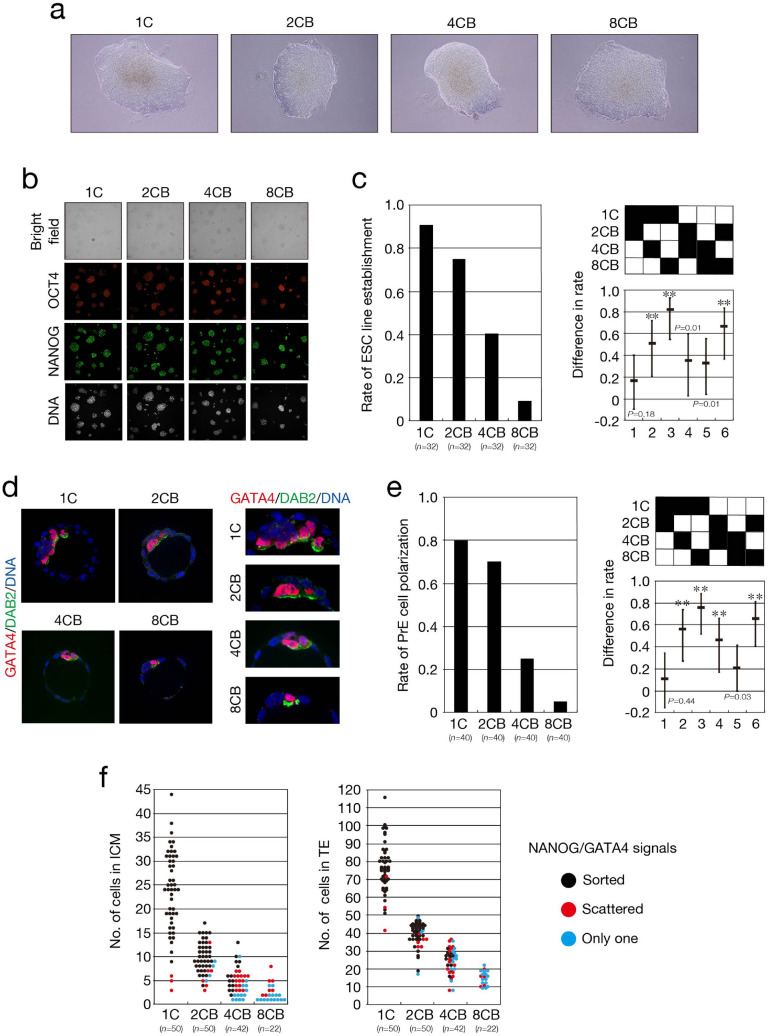
Figure 6.
Impaired formation of EPI and PrE in embryos derived from single blastomeres. (a–c) 1C, 2CB, 4CB, and 8CB pseudoblastocysts at 96 hpi were cultured for the establishment of ESC lines, which were subjected to immunofluorescence staining with anti-OCT4 and anti-NANOG for determination of their pluripotency. Representative phase-contrast images showing ICM outgrowth of pseudoblastocysts after culture for 14 days are shown in (a). Representative bright-field as well as OCT4 (red) and NANOG (green) immunofluorescence images of established ESC lines are shown in (b). DNA was stained with RedDot2 (white). The rate of ESC line establishment is shown in the left panel of (c), and the difference in the rates among the different types of pseudoblastocyst and its simultaneous 95% CI are shown in the right panel. The P values were determined with the two-sided Fisher’s exact test followed by adjustment with the BH method (FDR = 0.05). **P < 0.001. n indicates the number of pseudoblastocysts. All data were obtained from four replicate experiments. (d,e) 1C, 2CB, 4CB, and 8CB pseudoblastocysts at 120 hpi were stained with anti-GATA4 and anti-DAB2 for determination of the rate of PrE polarization. Representative images showing the expression of GATA4 (red) and apical-side expression of DAB2 (green) in cells located in the PrE compartment of blastocysts are shown in (d). DNA was stained with Hoechst 33342 (blue). The right panels are higher magnification views of the ICM of embryos in the left panels. The rate of PrE polarization is shown in the left panel of (e), and the difference in the rates of PrE polarization among the different types of embryo together with its simultaneous 95% CI are shown in the right panel. The P values were determined as in (c). **P < 0.001. n indicates the number of pseudoblastocysts. All data were obtained from three or four experiments performed on different days for each blastomere stage and were then analyzed. (f) Number of cells in the ICM (left panel) and in TE (right panel) of the blastocysts in Fig. 5e.

