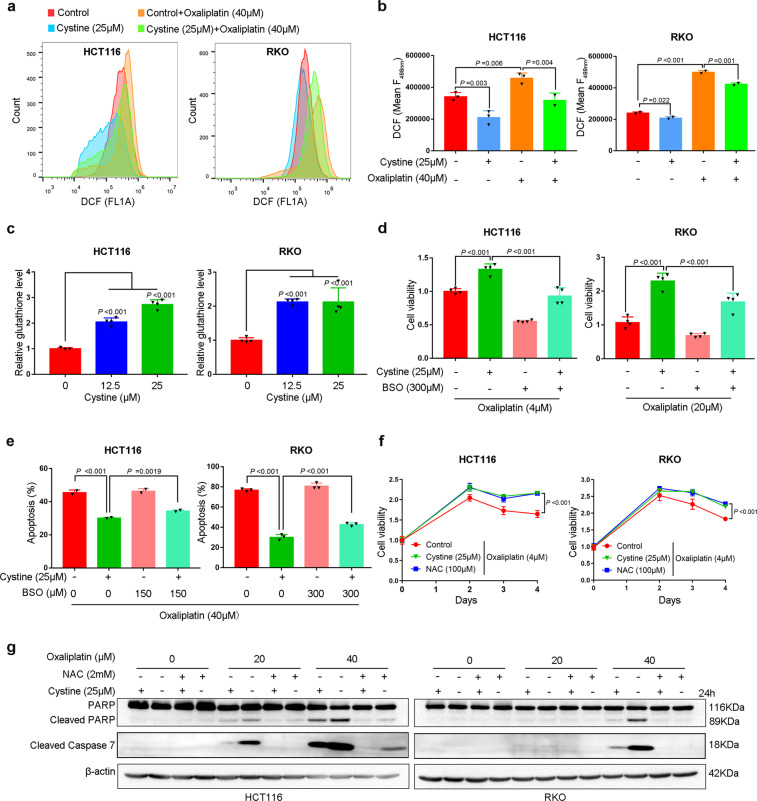
Fig. 6.
Cystine induces chemoresistance predominately by scavenging ROS via synthesizing GSH. a Cystine decreased ROS levels in colon cancer cells. Flow cytometry analysis of ROS levels using DCFDA staining in HCT116 and RKO cells. Cells were cultured for 24 h in conditioned media with 0 or 25 μM cystine, alone or in combination with 20 or 40 μM oxaliplatin. b Quantitative results of DCF using fluorescence intensity at 488 nm. P-value was determined by one-way analysis of variance. c Cystine significantly increased GSH levels in colon cancer cells. HCT116 and RKO cells were cultured for 12 h in conditional media with 0 or 25 μM cystine, P-value was determined by one-way analysis of variance. d Blockage of GSH synthesis by BSO abrogated cystine-induced oxaliplatin resistance. Cell viability were measured by the SRB assay after HCT116 and RKO cells were cultured for 96 h in conditional media with 0 or 25 μM cystine and treated with 4 or 20 μM oxaliplatin, alone or in combination with 300 μM BSO. P-value was determined by one-way analysis of variance. e BSO abrogated cystine-induced oxaliplatin resistance. Apoptosis was detected by annexin V staining and flow cytometry analysis. Cells were treated for 24 or 36 h with similar conditions from d. Quantitative results from three independent experiments were shown. P-value was determined by one-way analysis of variance. f NAC caused oxaliplatin resistance in colon cancer cells. Cell viability were measured by the SRB assay. Cells were cultured in conditioned media containing 0 or 25 μM cystine or 100 μM NAC, and treated with 4 μM oxaliplatin for 4 days. P-value was determined by one-way analysis of variance. g NAC and cystine decreased colon cancer apoptosis in response to oxaliplatin in vitro. Upon treatment with oxaliplatin (0–40 μM), HCT116 and RKO cells were cultured for 24 h in conditional media with 0 or 25 μM cystine or 2 mM NAC. Cleaved caspase 7 and PARP expression were detected by WB analysis. Data are shown as mean ± SD (b–f)

