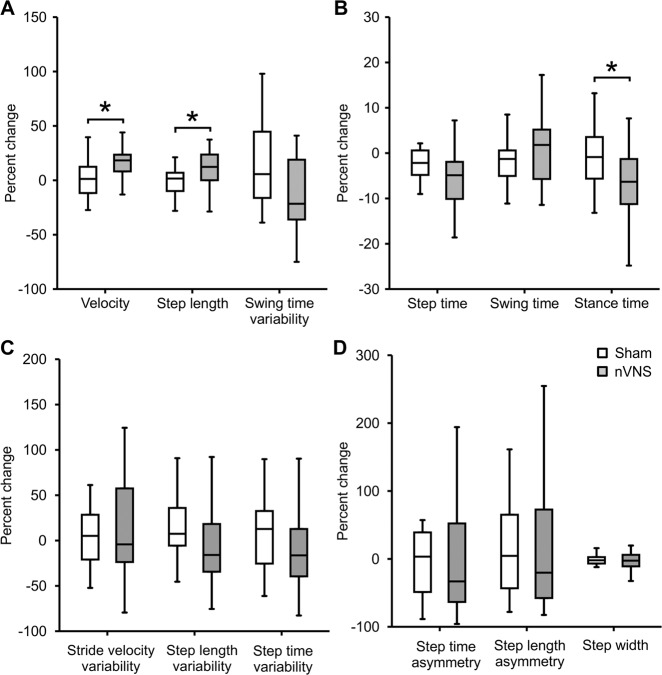
Fig. 3. Comparing the percentage change (from baseline) in gait parameters between active and sham nVNS groups.
Representative gait parameters are presented. A Percentage change (from baseline) in gait parameters from the ‘pace’ domain between the active nVNS and sham nVNS groups. B Percentage change (from baseline) in gait parameters from the ‘rhythm’ domain for active and sham nVNS groups. C Percentage change (from baseline) in gait parameters from the ‘variability’ domain. D Percentage change (from baseline) in gait parameters from the ‘asymmetry’ and ‘postural control’ domains. Differences were assessed statistically using the Wilcoxon Sign Rank Test, where p < 0.05 (*) was considered significant without correction for multiple comparison.

