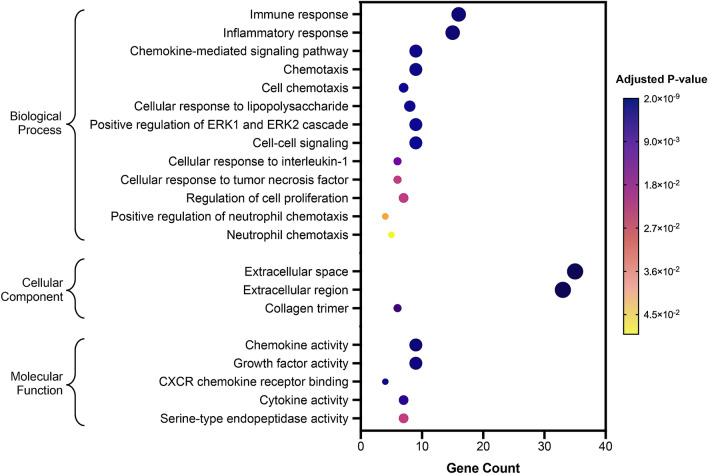
Figure 5.
Functional enrichment analysis of differentially expressed proteins. Results of over-representation (or enrichment) analysis using DAVID Bioinformatics showing the gene ontology (GO) terms that were significantly enriched in GO Biological Process, Cellular Component and Molecular Function. The largest gene counts are plotted in order of gene count. The size of the dots represents the number of proteins in the significant protein list associated with the GO terms and the color of the dots represents the adjusted p values.

