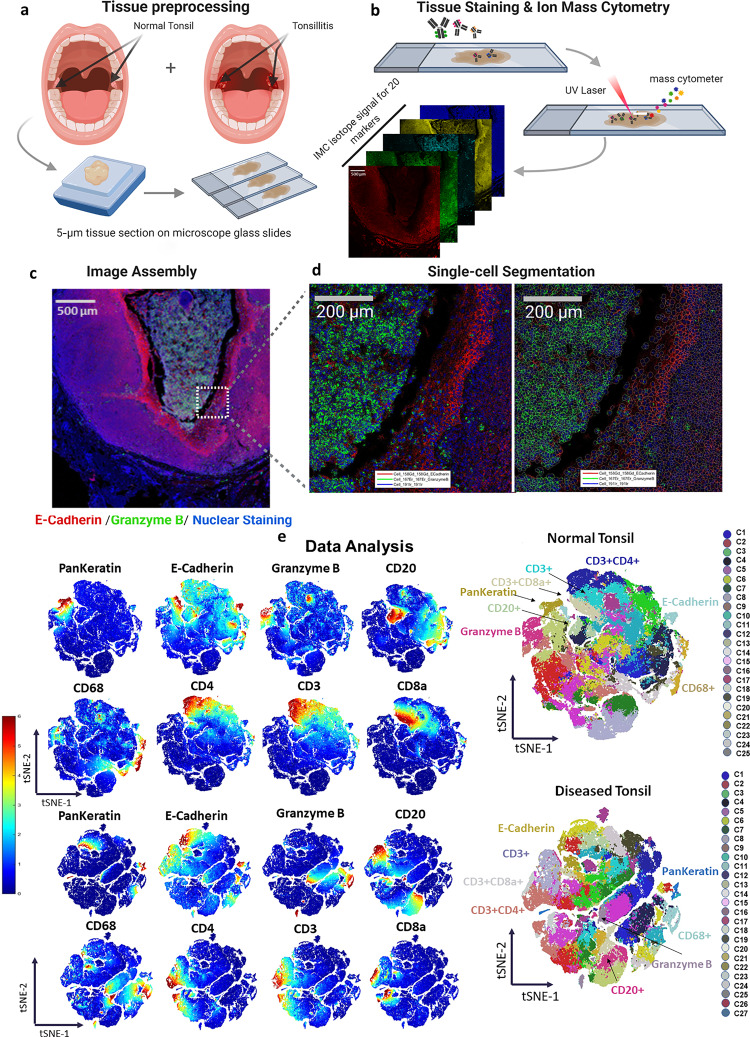
Fig. 1. The immune-epithelial landscape of healthy tonsil and chronic tonsillitis.
a Tissue samples were obtained from healthy and diseased tonsils (chronic tonsillitis) in 5-µm-thick formalin-fixed, paraffin-embedded samples. b The thin tissue sections were then stained with metal-conjugated antibodies and get ablated from the tissue’s surface through the argon plasma and analyzed by the time of flight mass spectrometer. c Individual marker images can be assembled and visualized using different colors to observe the marker’s coexpression and spatial organization. d Cells were segmented using CellProfiler software for single-cell quantification. e Single-cell analyses provide the marker expression distributions, including phenotype clustering based on the coexpression of markers. Phenographs of all normal and diseased ROIs show the different phenotypes that make up the sample to n = 25–27 groups. Immune and stromal markers were selected to cluster the entire dataset of the normal and diseased tonsil. The markers list includes CD20, CD68, CD3, CD4, CD8a, granzyme B, pankeratin, and E-cadherin. Created in Biorender.com.

