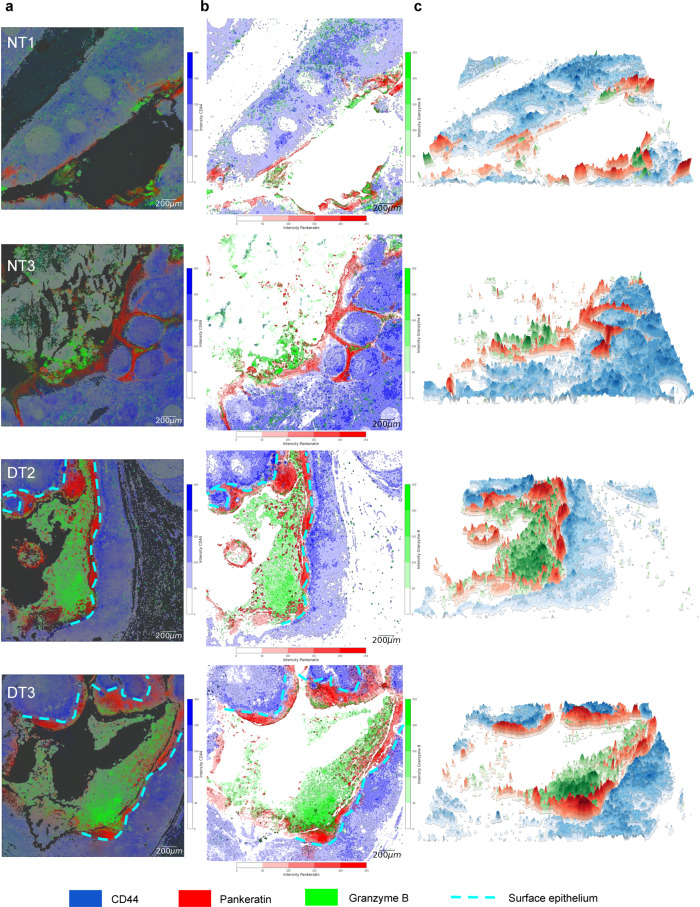
Fig. 7. Spatial topographic map for two-dimensional (2D) and three-dimensional (3D) visualization of CD44, Pankeratin, and Granzyme B layering in diseased and healthy tonsil tissues.
a 2D intensity plot of overlaid CD44 (blue), Pankeratin (red), Granzyme B (green) markers is shown. The scale bar is 200 µm. b 2D topography plot of density maps of markers in the form of contours is presented. The light blue dashed lines denoted the surface epithelial boundary and the crypt region in the disease tonsil. The scale bar is 200 µm. c 3D topography plot of the same three markers is shown. Distinct 3D areas with high CD44 and Pankeratin expressions were layered concerning each other’s spatial distribution in diseased tonsils, whereas CD44 enrichment was more randomly distributed in normal tonsils. The scale bar is 200 µm.

