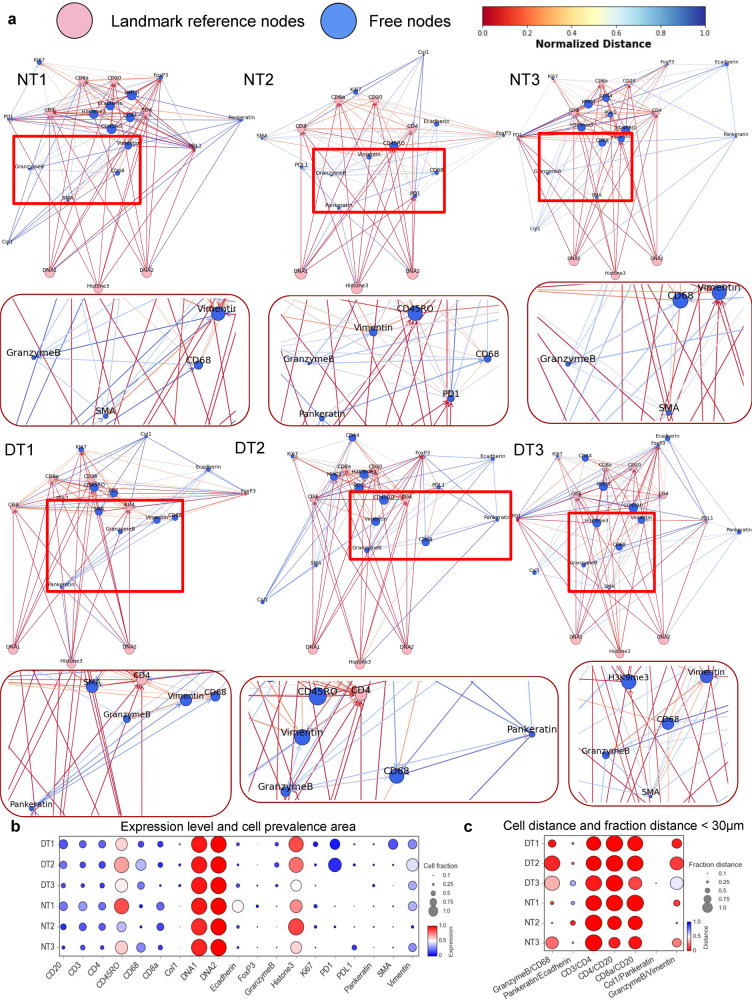
Fig. 8. Spatial reference framework of multiplied markers in single-cells of pathological clusters in healthy tonsil and chronic tonsillitis cases.
a The spatial reference framework shows the highest five k-nearest neighbor (k-NN) distances for each marker. The pink nodes represent fixed reference landmark markers, whereas blue nodes denote position-free markers, providing a reference of marker alterations from health to disease across tonsil tissue biology. The colors of the edge between the nodes represent the relative nearest neighbor distance among markers for individual cells. b Dot plot representations of marker expression levels and cell prevalence areas across three normal datasets and three disease datasets are shown. The circle area represents the cell prevalence area of a specific marker, and the colormap represents the normalized expression level. c Dot plot represents the mean value of pairwise marker sets of cell-to-cell distances and fraction of length inferior to 30 μm across three normal tonsil datasets and three diseased tonsil datasets. The circle area represents the fraction of measurement within 30 μm of a specific marker, and the colormap indicates the mean cell-to-cell distance.

