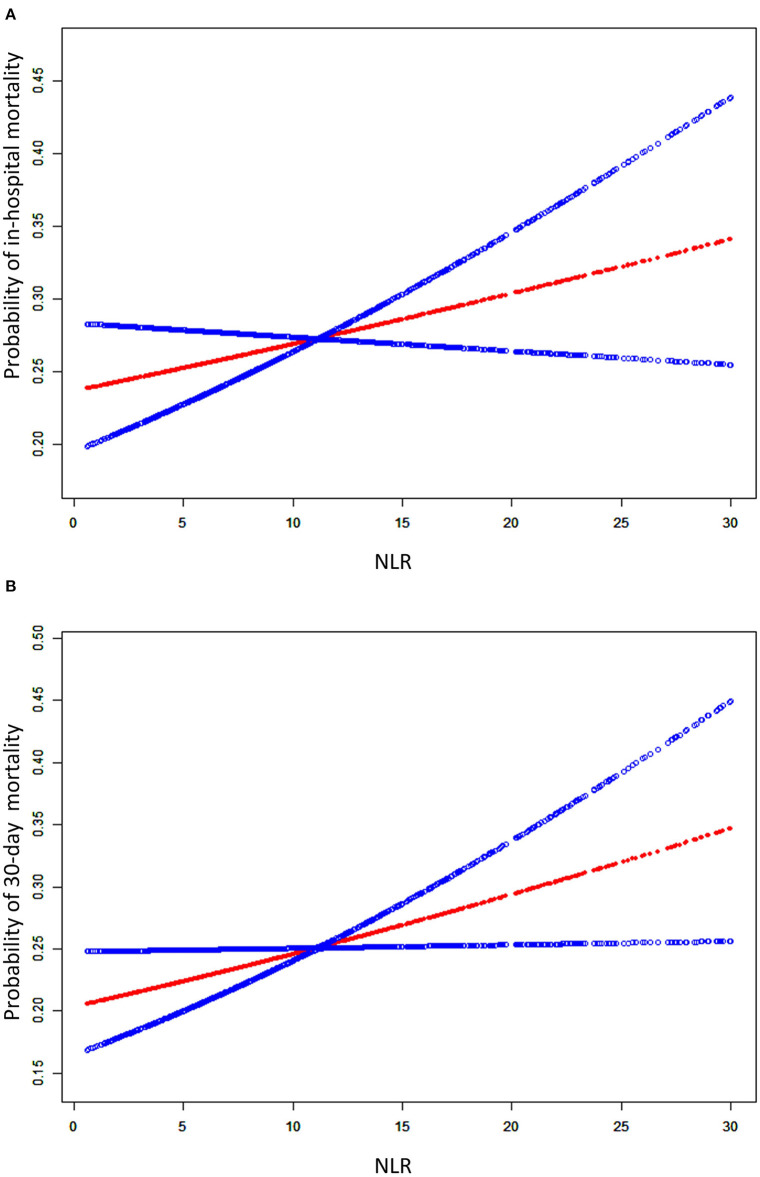
Figure 2.
A smooth curve fitting for the relationship between the baseline NLR and the risk of in-hospital mortality (A) and 30-day mortality (B). The resulting figures show the risk of mortality in the y-axis and the NLR (continuous variable) in the x-axis. The red line shows the dose-response curve between NLR and probability of short-term mortality, the two blue lines refer to 95% CIs. A positive relationship between NLR and the risk of short-term mortality was observed after adjusting for age, gender, ethnicity, smoking, admission type, COPD, hypertension, tumor, diabetes mellitus, renal failure, SID30, pneumonia, sepsis, aspiration, trauma/surgery, other non-pulmonary, PaO2/FiO2, SAPS II, OASIS, SOFA, corticosteroids therapy, antibiotic therapy, vasopressor therapy, ventilation received, and renal replacement therapy by spline smoothing plot.

