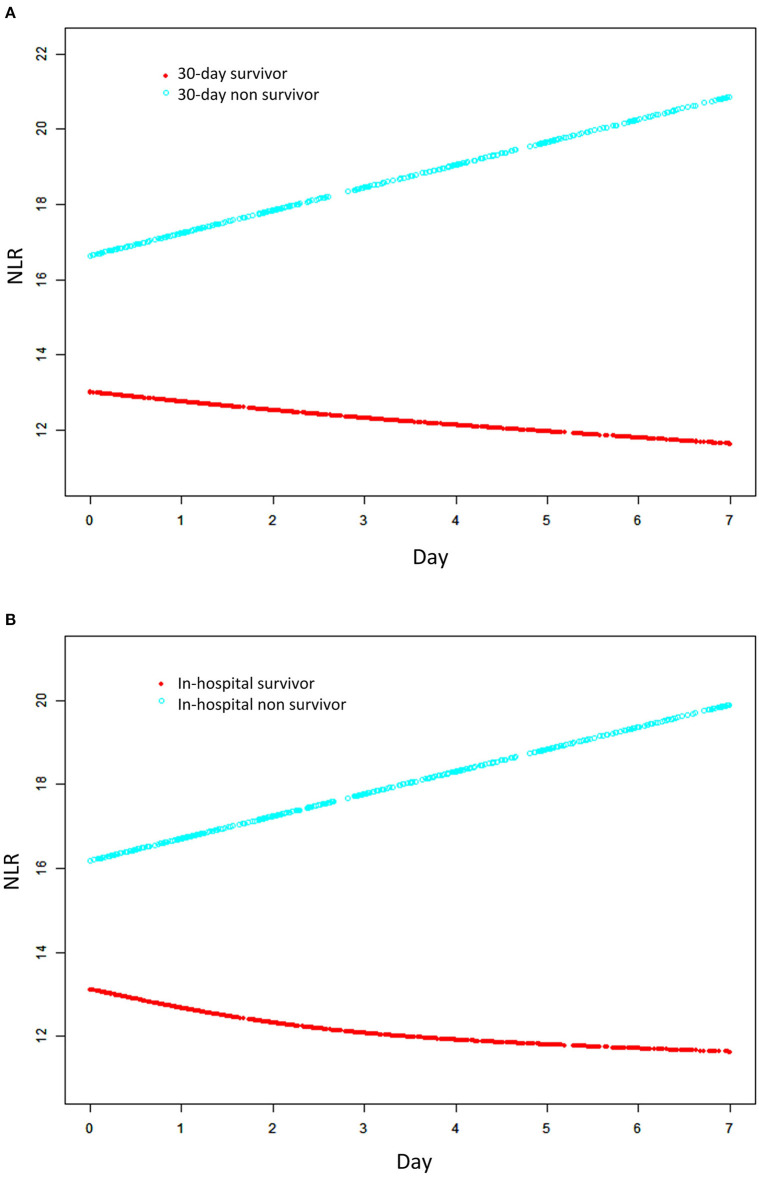
Figure 3.
Association between changes in NRL and 30-day mortality (A) and in-hospital mortality (B). A linear association between changes in NLR and mortality was found in a generalized additive mix model (GAMM). Smooth curve fitting graph illustrated the NLR in 1164 ARDS patients based on the days after admission to ICU. The red line represented the survivors. The blue line represented the non-survivors. All adjusted for age, gender, ethnicity, smoking, admission type, COPD, hypertension, tumor, diabetes mellitus, renal failure, SID30, pneumonia, sepsis, aspiration, trauma/surgery, other non-pulmonary, PaO2/FiO2, SAPS II, OASIS, SOFA, corticosteroids therapy, antibiotic therapy, vasopressor therapy, ventilation received, and renal replacement therapy.

