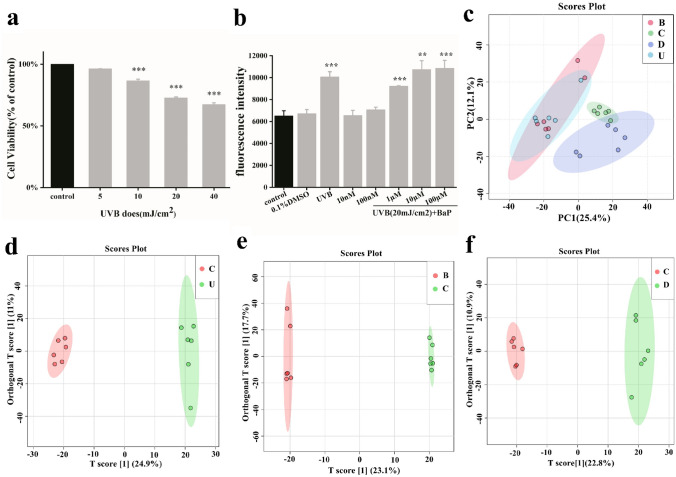
Figure 1.
Principal components analysis for metabonomics of damaged cell models. (a) Cytotoxicity of HFF-1 exposed to different UVB irradiation intensities. (b) BaP induced reactive oxygen species production. Cells were exposed to 5–40 mJ/cm2 UVB irradiation and the doses of BaP ranged from 10 nM to 100 µM. (c) PCA score plots. (d–f) OPLS-DA score plots based on the data from UPLC-ESI (+)-QTOF-MS for distinguishing C versus U (R2Y = 99.6%, Q2 = 85.6%), C versus B (R2Y = 99.6%, Q2 = 86.1%), and C versus D (R2Y = 99.4%, Q2 = 86.9%) for selecting potential markers.

