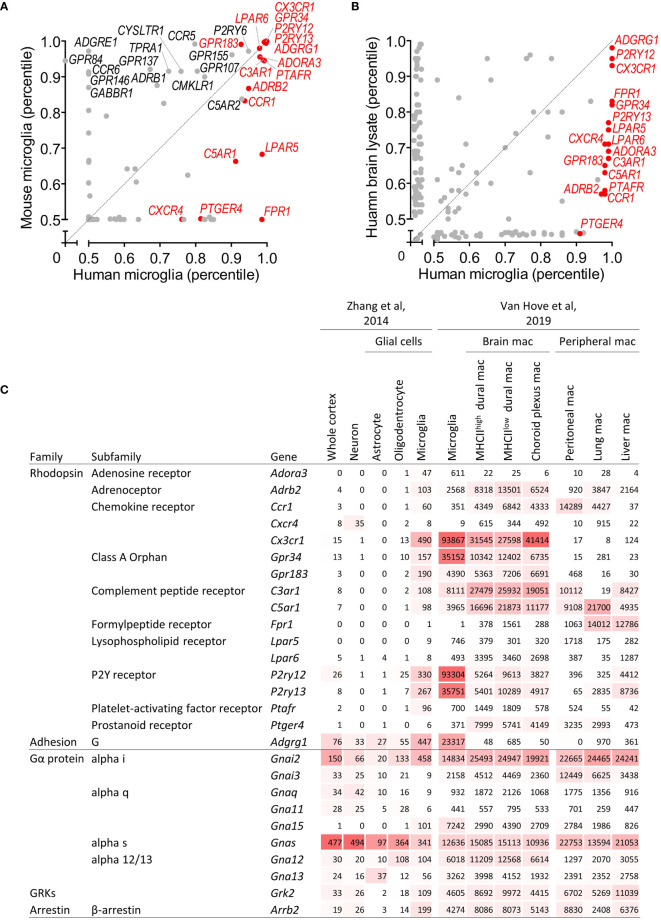
Figure 1.
Identification of GPCR and GPCR signaling molecule genes expressed in microglia. (A) Scatter plot providing GPCR gene expression in microglia isolated from human and mice as percentile of all human/mouse genes (8). (B) Scatter plot providing GPCR gene expression in brain and microglia of human as percentile of all genes (10). (C) Expression of GPCR and GPCR signaling molecule genes in mouse cortical tissue, neurons, astrocytes, oligodendrocytes, and microglia (11), and in mouse microglia, non-parenchymal brain and peripheral tissue macrophages (12). Expression is provided as FPKM (11) and gene count (12), respectively. mac, macrophages.

