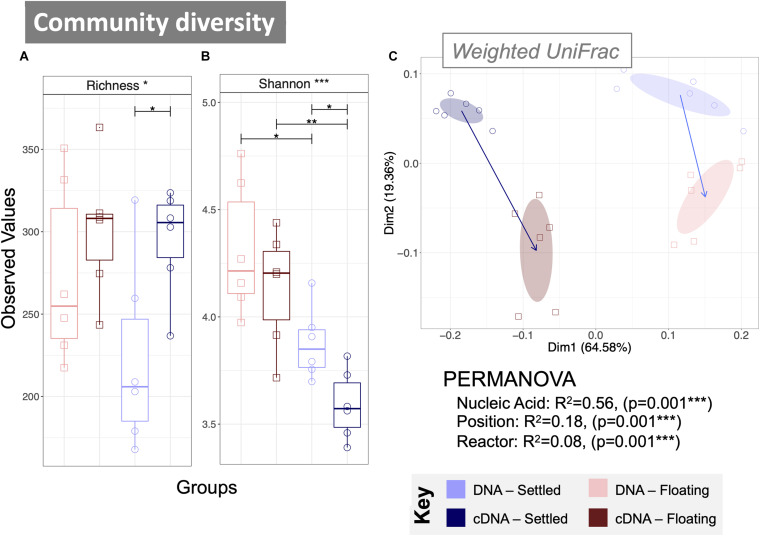
FIGURE 2.
Microbial community diversity according to variances in 16S rRNA genes from both DNA and cDNA (n = 6) measured using alpha diversity measures: (A) rarefied richness and (B) Shannon Entropy; and beta diversity using principle coordinate analysis (PCoA) with (C) weighted UniFrac distances. Samples are indicated by colour, and the ellipses are drawn at a 95% CI for all samples from each category, where arrows mark the direction of change in the community structure from mean ordination of settled samples to the mean ordination of floating samples for each nucleic acid type—the length indicating the amount of change. PERMANOVA (distances between groups) indicate significant differences according to nucleic acid, position and reactor. Lines for (A,B) connect two categories where the differences were significant (ANOVA) with *(p < 0.05), **(p < 0.01), or ***(p < 0.001).

