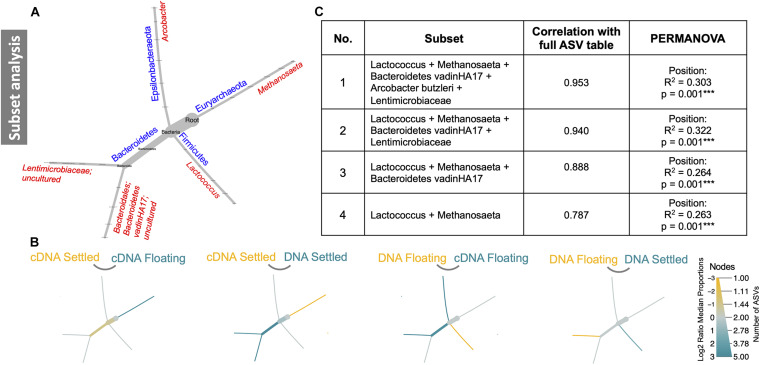
FIGURE 5.
Subset analysis of a subset of five ASVs. These five ASVs are depicted in reduced phylogenetic heat trees where (A) is the reference tree; (B) highlights branches that were enriched between the two given categories, where colour indicates the category of high abundance; and (C) shows four combinations of the five subset ASVs and how they contribute significantly to differences in the microbiome.

