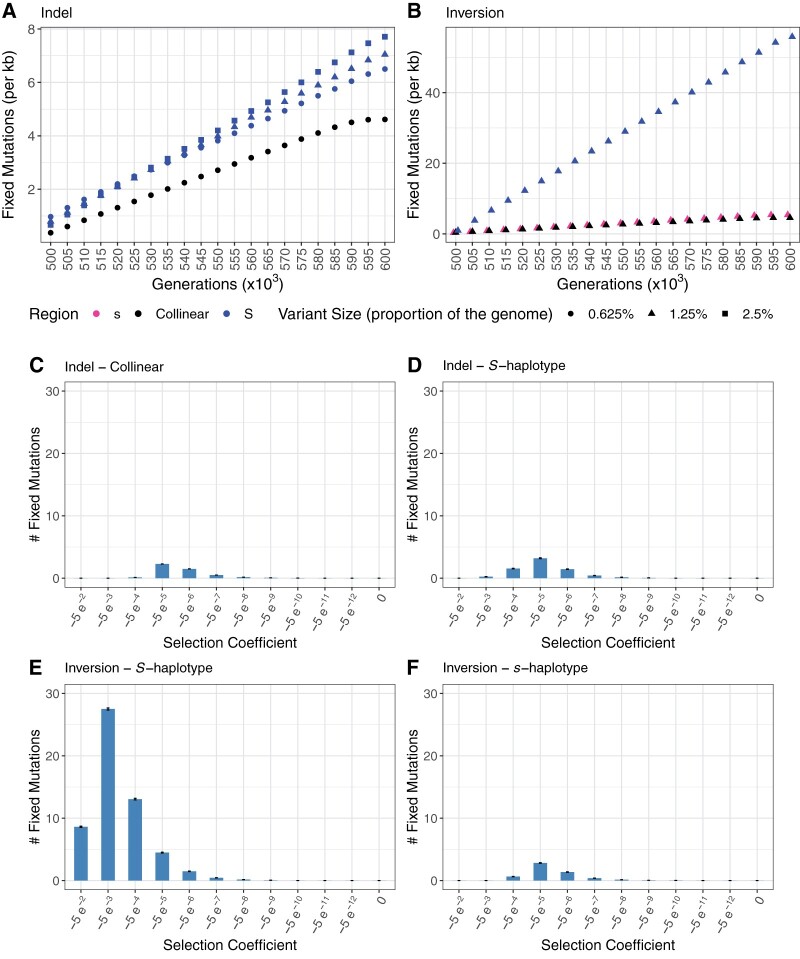
Figure Box 2.
Dynamics of deleterious mutation accumulation in supergenes. (A) Deleterious mutation accumulation over time is accelerated in the hemizygous S-haplotype (blue) compared with the collinear region (black). Shape indicates the size of the indel (circle −0.625%, triangle 1.25%, square 2.5%). (B) Deleterious mutation accumulation over time is accelerated in the inverted S-haplotype (blue) compared with the collinear region (black) and the standard arrangement s-haplotype (pink). Histogram showing selection coefficients of fixed mutations at the end of the simulation (600 k generations) in the (C) collinear region of the indel simulations, (D) hemizygous S-haplotype, (E) inversion S-haplotype, and (F) inversion standard arrangement s-haplotype. Error bars indicate ±standard error.

