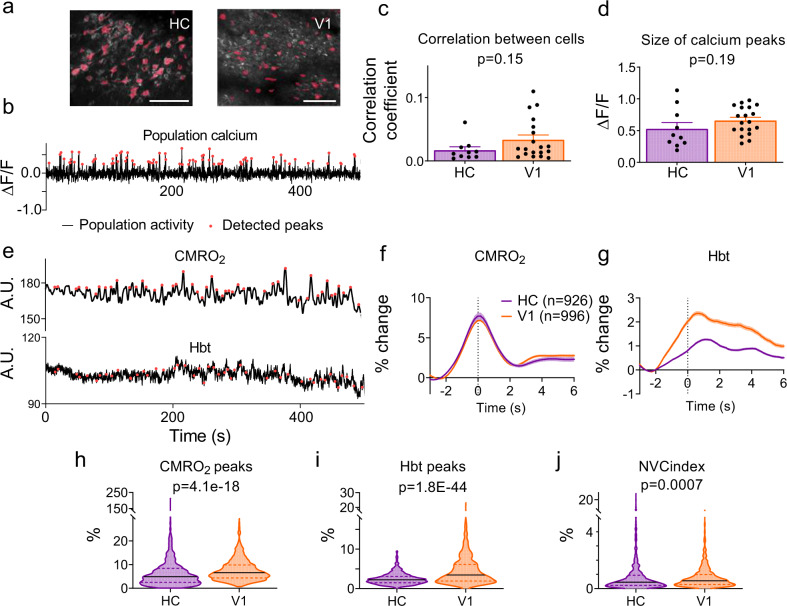
Fig. 5. Wide-field neuronal activity patterns.
a Representative wide field-of-view recording of calcium signals (white; maximum projection across time) in HC (left, 1 of 10 independent recordings) and V1 (right, 1 of 19 independent recordings). Regions of interest (ROIs) used to measure cell activity are displayed in pink. Scale bar represents 100 μm. b Example neuronal calcium trace, averaged across all detected ROIs. Times when net activity peaks (>2 SD above baseline mean) are shown by red dots. Neither c the correlation (Pearson’s R) between individual cells within a field-of-view was different, nor d the size of net calcium peaks between the HC (10 recordings from four animals, 407 cells detected in total) and V1 (19 recordings from three animals, 338 cells in total). Dots in c and d represent separate recording sessions. e Example CMRO2 fluctuations over time and corresponding total haemoglobin (Hbt). Detected signal peaks are marked in red. f Averaged CMRO2 peaks per region, and g the Hbt in response to these CMRO2 peaks (HC data represent 926 peaks taken from nine animals across 37 recordings, V1 data represent 996 peaks taken from 10 animals across 46 recordings). h The magnitude of these CMRO2 peaks was larger in V1 than HC, and i Hbt increased more in V1 than in HC within 5 s of an increase in CMRO2. j The NVCindex was calculated by dividing Hbt/CMRO2, and was significantly lower in HC (n = 926 and n = 996 data points examined for CMRO2, Hbt and NVCindex statistical comparisons). P values represent the result of Mann–Whitney U tests for all data except d which was a result of independent sample t tests (see Statistics Report Table SR3). Bar charts and traces show mean ± SEM, violin plots show median and interquartile range. Source data are provided as a Source Data file.

