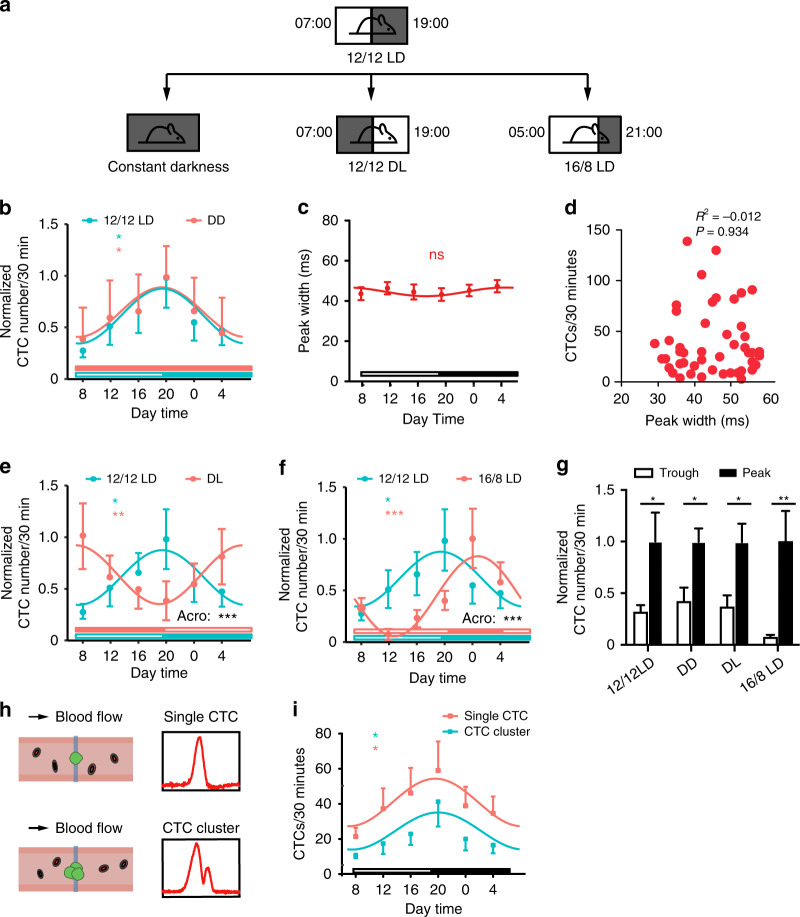
Fig. 3. CTC counts exhibited circadian oscillation in mice monitored by fluorescence IVFC.
a Schematic of the light-dark cycle. b Circadian rhythm of CTCs in mice maintained under 12/12 LD and DD conditions. Unfilled bars: light phase, filled bars: dark phase. The statistical significance of the fluctuation was evaluated using Cosinor analysis, n = 5–8 mice. c Daily variations in the peak widths of the IVFC signals detected in mice maintained under 12/12 LD conditions. Cosinor analysis revealed no significant fluctuation, n = 8 mice. d Pearson correlation analysis of the CTC count with the peak width (R2 = −0.012, P = 0.934). e Circadian rhythm of CTCs in mice maintained under 12/12 LD and DL conditions. The statistical significance of the fluctuation was evaluated using Cosinor analysis, n = 3–8 mice. There was a significant difference in acrophase (Acro) between the 12/12 LD and DL groups. f Circadian rhythm of CTCs in mice maintained under 12/12 LD and 16/8 LD conditions. The statistical significance of the fluctuation was evaluated using Cosinor analysis, n = 6–8 mice. There was a significant difference in acrophase (Acro) between the 12/12 LD and 16/8 LD groups. g CTC counts at the peak and trough of the rhythm, n = 3–8 mice, unpaired t-test. h Schematic diagram showing the fluorescence IVFC signals of a single CTC and a CTC cluster. i Daily variation in the numbers of single CTC and CTC clusters detected in mice maintained under 12/12 LD conditions. *P < 0.05, **P < 0.01, ***P < 0.001. All data are presented as the mean SEM

