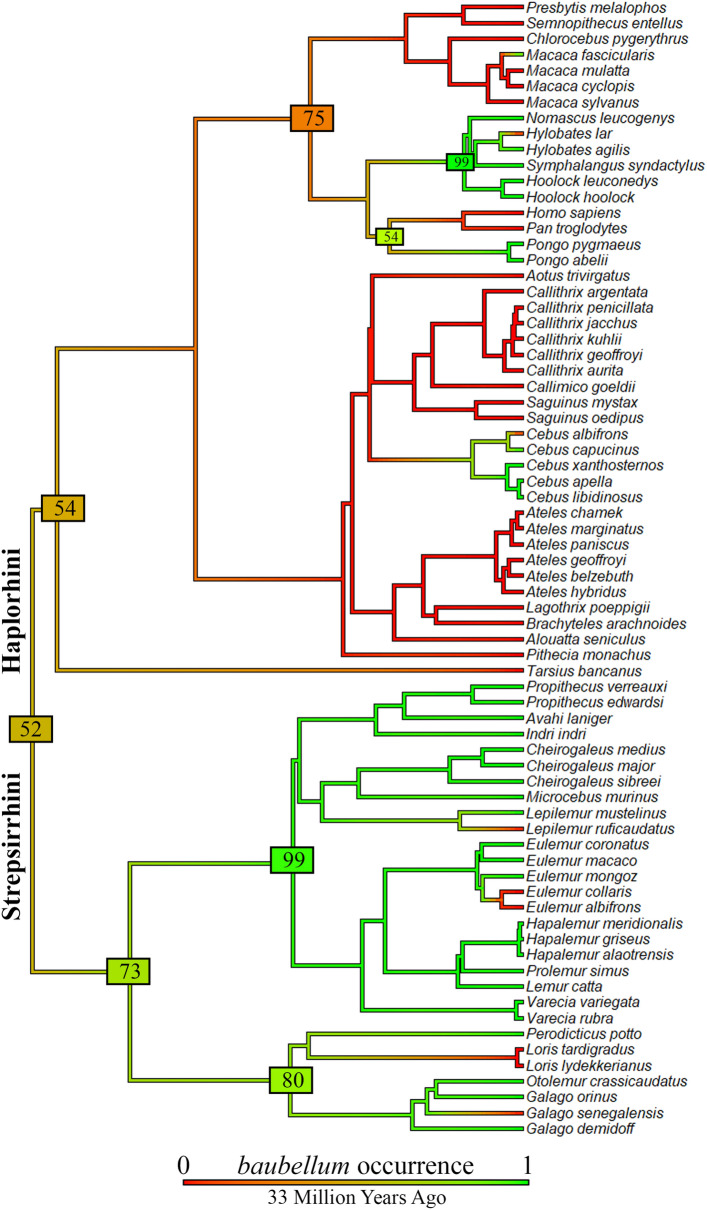
Figure 3.
Ancestral character state reconstruction of baubellum excluding outgroups. Results from 1000 stochastic character maps (where the character analyzed is the baubellum occurrence) displayed in aggregate (outgroups were excluded). The colour of edges in the tree gives the posterior probability (computed as the relative frequency across stochastic maps) of each baubellum state through the history of the clade. Green indicates a high posterior probability of baubellum presence and numbers in green (or light green) boxes indicate the proportion of iterations that mapped baubellum presence to those particular branches. The length of the legend also gives a scale for the branch tree length, (in this case in Millions of Years Ago). Phylogeny by Springer71, dropped. Figure generated in R (v. 4.0.3, https://www.R-project.org/)114.

