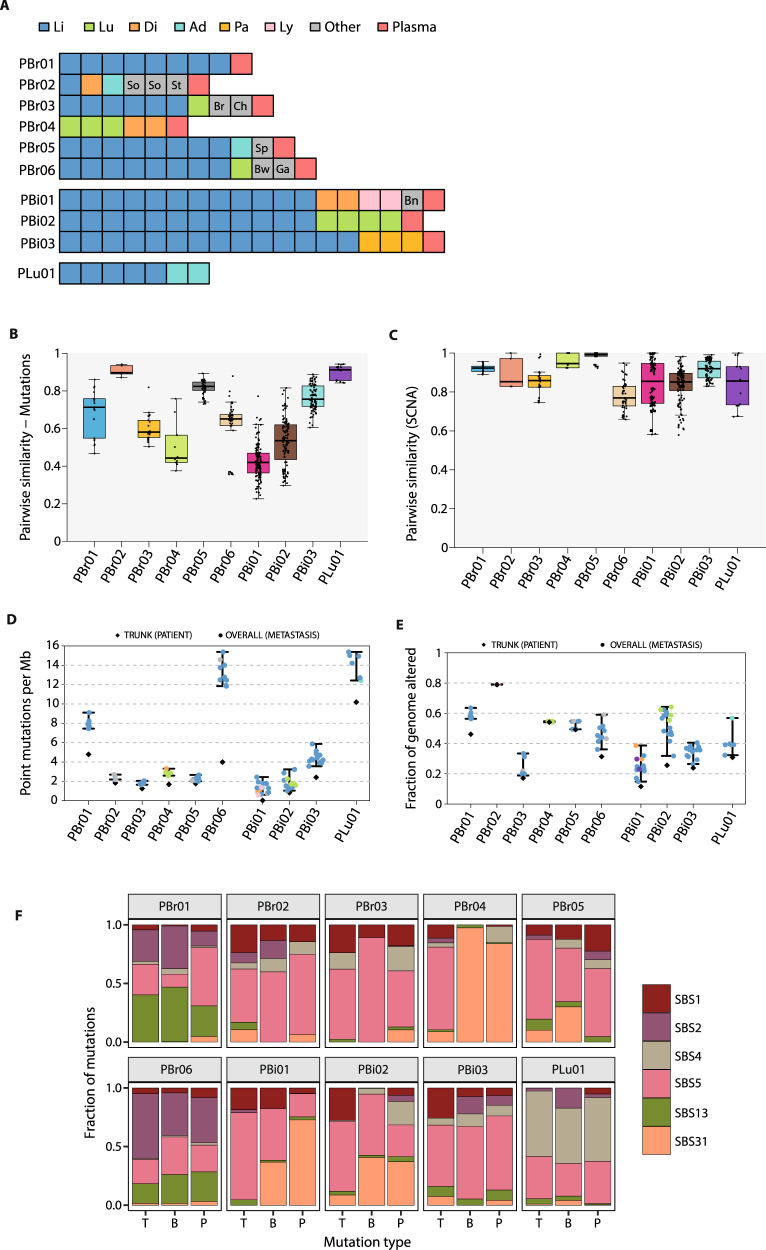
Fig. 1. Profiling metastatic heterogeneity using rapid autopsies.
A Summary of lesions profiled in the rapid autopsy cohort. Li liver, Lu lung, Di diaphragm, Ad adrenal gland, Pa pancreas, Ly lymph node, So soft tissue, St stomach, Br breast, Ch chest wall, Sp spleen, Bw bowel, Ga gallbladder, Bn bone. B For each patient, we computed the pairwise similarity based on the Jaccard index for every pair of postmortem tissue samples. Pairwise similarities, represented by the points, range from 0 (no overlap in mutations) to 1 (identical lesions). The boxplots represent the distributions of these similarities across patients. For each patient, the boxplot’s whiskers span the minimum and maximum of the distribution (excluding outliers), the box spans the lower and upper quantiles, and the center represents the median value of the distribution. C As for point mutations, pairwise similarity score was computed for SCNA segments. Boxplots depict the distributions as described in B. D Tumor mutation burden (TMB) was estimated by summing all classes of sSNVs and indels present at an allelic frequency of at least 0.5%. All bases in coding regions in the exome-capture panel that were covered by at least 30 reads were considered. Colored points depict TMB in individual lesions, whereas black diamonds represent the truncal mutation rate across all lesions from a patient. Error bars indicate the range of TMB estimates across lesions from a patient. E Copy number instability (CIN) was defined as the fraction of the genome altered by any copy number event. As for TMB, colored circular points and black diamonds represent individual lesion-specific and truncal patient-specific CIN, respectively. Error bars indicate the range of CIN estimates across lesions from a patient. F Mutation signatures identified in subsets of mutations across the ten patients. Bars depict the proportions of mutations within each subset that were assigned to the indicated mutation signature from the COSMIC database. Single-base substitution 1 (SBS1) and SBS5 are associated with patient age, and have been described as resembling molecular clocks. SBS2 and SBS13 are linked with AID/APOBEC activity. SBS4 has been associated with tobacco exposure and SBS31 has been linked with the mutagenic effects of platinum therapies. Source data are available for this figure.

