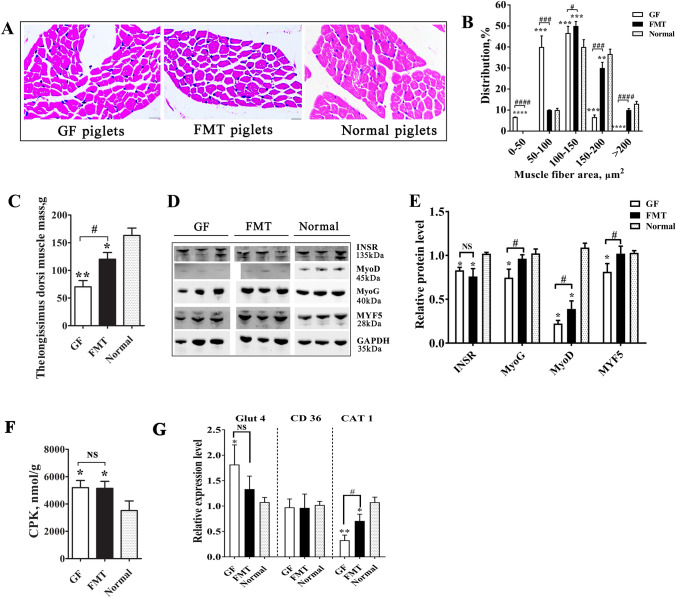
Figure 3.
Comparison of muscle growth in different piglets. (A) Sections of the longissimus dorsi muscle with hematoxylin–eosin (HE) staining. (B) Sectional area of muscle fiber. (C) Weight of the left longissimus dorsi muscle mass. (D) Protein levels of key myogenic factors and insulin receptor (INSR) as detected by Western blotting. The full-length blots are presented in Supplementary Fig. 1. (E) Relative quantitative analysis of the protein levels. (F) Enzyme activity of creatine phosphokinase (CPK) in muscle tissue. (G) Expression levels of glucose transporter 4 (Glut4), fatty acid translocase (FAT/CD36) and cationic amino acid transporter 1 (CAT1). mRNA expression in the muscle tissue was determined by qPCR. N = 3, the data are presented as the means ± s.e.m. *P < 0.05, **P < 0.01, ***P < 0.001, and ****P < 0.0001 compared to the normal piglets (control). #P < 0.05, ###P < 0.001, and ####P < 0.0001 between the GF piglets and the FMT piglets. NS not significant, GF piglets germ-free piglets, FMT piglets GF piglets with fecal microbiota transplantation.

