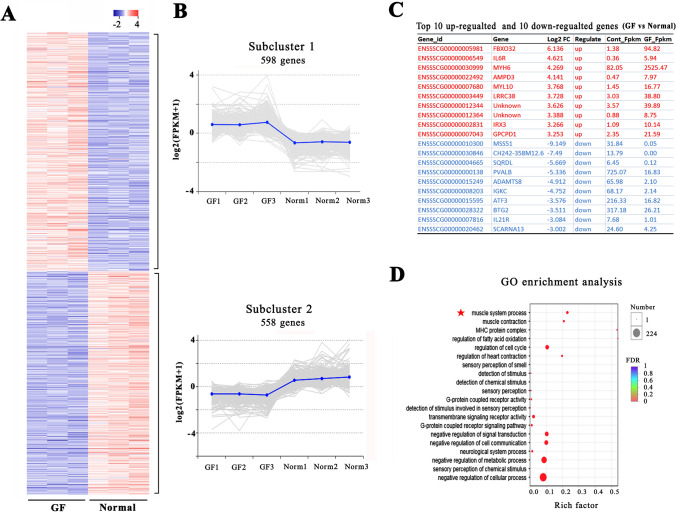
Figure 4.
RNA-seq analysis of protein-coding gene expression in the muscle tissues of GF piglets and normal piglets. (A) Heatmap of 1156 significantly differentially expressed genes (DEGs). The red dots and the blue dots indicate up- or downregulated genes with fold changes > 2.0 and P adjusted < 0.05. (B) Abundance patterns of the genes segregated into two clusters after k-means analysis. (C) Top 10 upregulated genes and 10 downregulated genes in the muscle tissue of GF piglets vs. normal piglets. (D) DEGs enriched in the GO term muscle system process.

