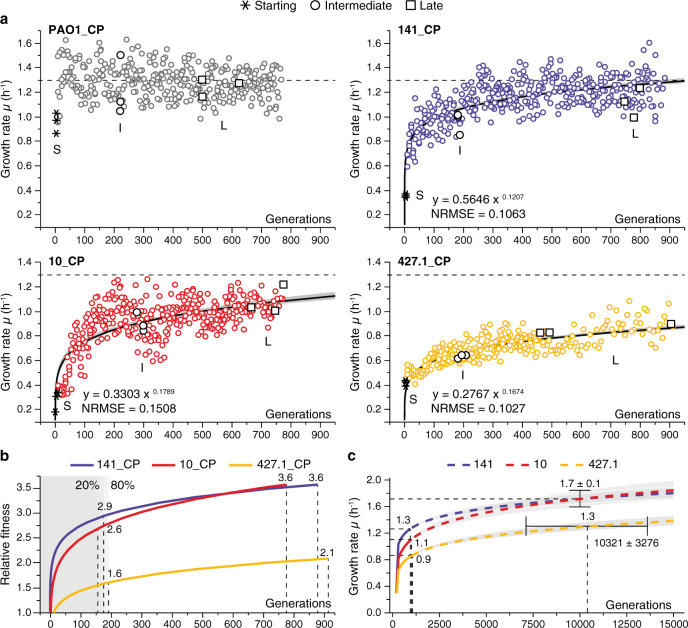
Fig. 1. Fitness trajectories of evolving Pseudomonas aeruginosa populations.
a The plots represent the increase in growth rate of the combined populations (CP) constituted by merging the data of three independent populations evolved in parallel from each starting strain PAO1_S, 141_S, 10_S and 427.1_S (see Supplementary Fig. 2 for each independent population). The dots represent the growth rate of each population during ALE. The asterisks represent the growth rate of each starting (S) strain. The black circles and squares indicate the populations from which single colonies were isolated and further analyzed. The black curves show the fit of a power-law model and the grey shaded area the 95% confidence limits. The models, including the normalized root-mean-square error (NRMSE), are indicated in each plot. b Relative fitness observed in the CP. The average fitness increase of each CP was calculated relative to the growth rate of the starting S strains using the power-law model. The fitness at 20 and 80% of generations is indicated in the plot. c Growth rate increase prediction for the evolving populations. The continuous lines show the fitness trajectories determined using the experimental data as in panel a, while the dashed lines show the simulated posterior distribution of the growth rate according to the power-law models for each CP. The grey shaded areas and black bars show the 95% confidence limits of the predictions. Source data are provided as a Source Data file.

