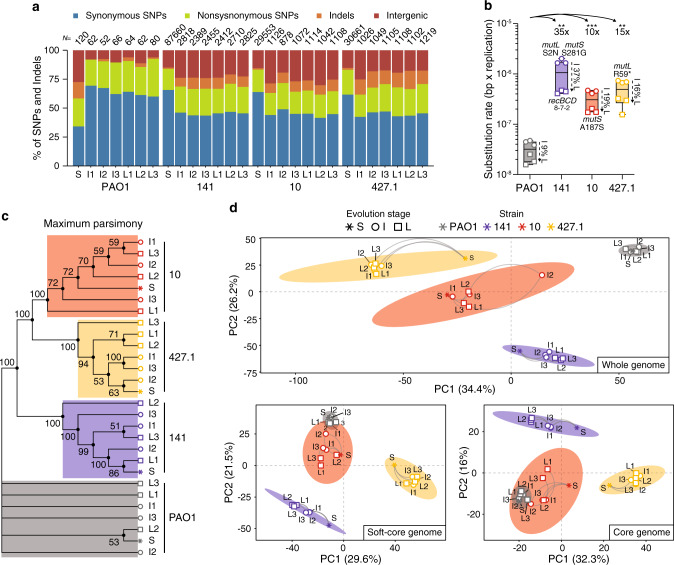
Fig. 2. Mutational pattern and transcriptional landscape of evolving Pseudomonas aeruginosa strains.
a Distribution of the different types of mutations identified in the genomes of the starting (S), intermediate (I) and late (L) strains. The total number of mutations identified relative to PAO1 (S strains) or relative to each S strain (I and L strains) are shown above each column. b Substitution rate (bp per generation) for I and L evolved strains. Differences between strains were calculated on the average of the substitution rate for I and L strains. The fold-change and the significance (two-tailed Student t-test, P values: **<0.0021; ***<0.0002; n = 6 biological independent strains) relative to PAO1 are shown. The decrease in substitution rate observed in L strains is calculated as percentage relative to I strains. Data are presented as minimum, 25th percentile, median, 75th percentile, and maximum. Amino acid changes likely causing hypermutability are indicated for each strain. Numbers under the recBCD genes (141 strains) indicate the number of nonsynonymous mutations identified in each gene. c Maximum parsimony reconstruction of the sequenced strains. The tree is based on 8065 missense and nonsense SNP mutations accumulated during ALE. Branches corresponding to partitions reproduced in less than 50% of bootstrap replicates are collapsed. The percentages of replicate trees in which the associated taxa clustered together in the bootstrap test (500 replicates) are shown next to the branches. d Unsupervised principal component (PCA) analysis performed on whole, soft-core and core genome expression data for each strain. The ellipses represent the k-means clustering of the transcriptional profiles of the strains. Source data are provided as a Source Data file.

