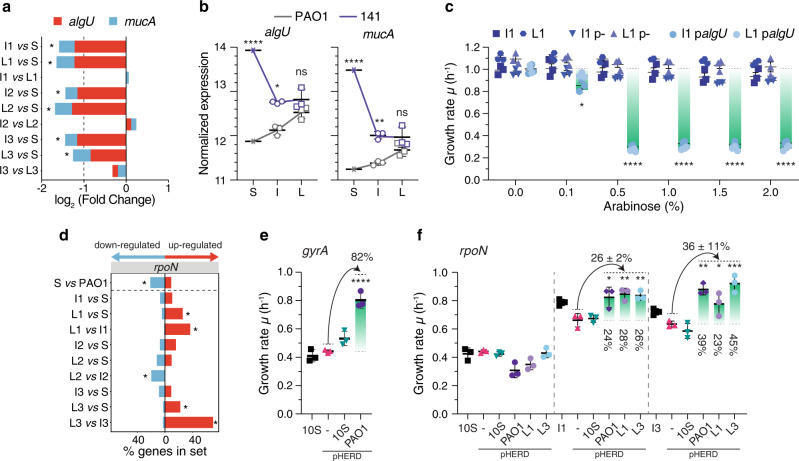
Fig. 3. Mutations and transcriptional profile changes leading to increased growth rate in the evolved strains.
a Expression of algU and mucA genes in 141 strains. The asterisks indicate statistically significant differences in the level of expression for both genes among the compared pairs of strains calculated by negative binomial distribution testing (adjusted P value < 0.01). b Normalized expression level of algU and mucA genes in S, I and L strains of PAO1 and 141. Statistical significance was calculated by two-way ANOVA with Sidak’s multiple comparison test (P values: *<0.05; ****<0.0001; ns not significant; n = 3 biologically independent strains). Data are presented as mean values ± SD. c Growth rate reduction in strains 141_I1 and 141_L1 upon expression of algU gene from plasmids p- (empty plasmid) and palgU (algU gene from strain 141_S) at increasing concentration of arabinose. Statistical significance relative to the absence of inducer (0%) was calculated by two-way ANOVA with Dunnett’s multiple comparison test (P values: *<0.05; ****<0.0001; n = 3 biologically independent experiments). Data are presented as mean values ± SD. d Distribution of differentially expressed genes within the rpoN sigma factor regulon in strains 10. Genes within the rpoN regulon were obtained from refs. 63,71. The percentage of genes up- and down-regulated is reported in each pairwise comparison. Asterisks denote sets of genes significantly enriched (adjusted P value ≤ 0.05, hypergeometric test after Bonferroni correction). e, f Complementation of gyrA and rpoN mutations in strains 10. e Growth rate changes in strain 10_S upon expression of gyrA gene from plasmids pHERD: - (empty plasmid), 10_S (gyrA gene from strain 10_S) and PAO1 (gyrA gene from strain PAO1). f Growth rate changes in strains 10_S, 10_I1 and 10_I3 upon expression of rpoN gene from plasmids pHERD: - (empty plasmid), 10_S (rpoN gene from strain 10_S), PAO1 (rpoN gene from strain PAO1), L1 (rpoN gene from strain 10_L1) and L3 (rpoN gene from strain 10_L3). For complementation assays, 0.1% of arabinose was used. Growth rate differences were calculated relative to the strain expressing the pHERD(-) empty plasmid by one-way ANOVA with Dunnett’s multiple comparison test (P values: *<0.05; **<0.0021; ***<0.0002; ****<0.0001; n = 3 biologically independent experiments). If not otherwise indicated, differences between strains were not significant. Data are presented as mean values ± SD. Source data are provided as a Source Data file.

