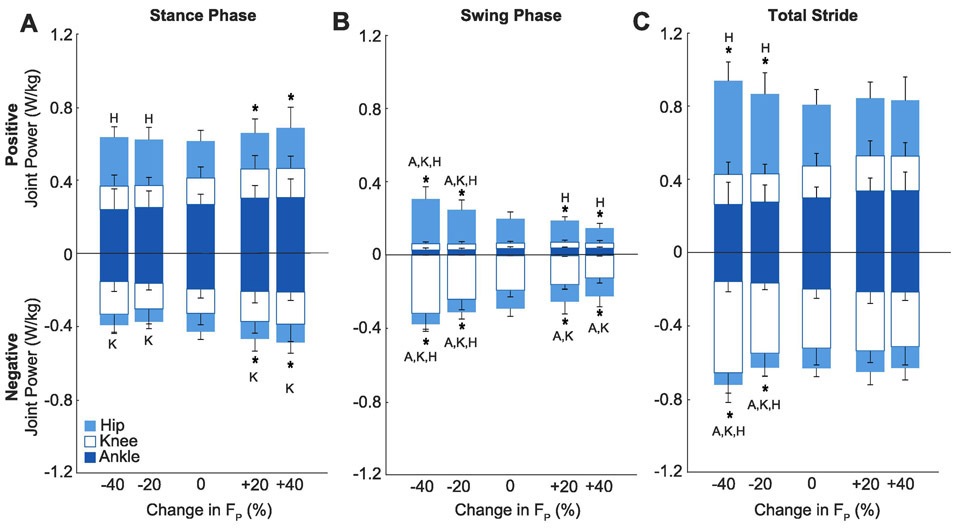
Figure 3.
Group average (standard deviation) positive and negative joint powers (i.e., work rates) for the ankle, knee, and hip. Data were calculated from the time integral of the instantaneous power curves normalized by average stance time to estimate the cumulative muscular demand per unit time. Conditions included biofeedback trials at targeted −40%, −20%, 0%, +20%, +40% peak trailing limb propulsion (FP). Letters represent a significant pairwise comparison from the normal walking condition (p<0.05) for ankle (A), knee (K), and hip (H). Asterisks (*) indicate a significant pairwise comparison for total (i.e., Ankle + Knee + Hip) joint power versus normal walking (p<0.05).

