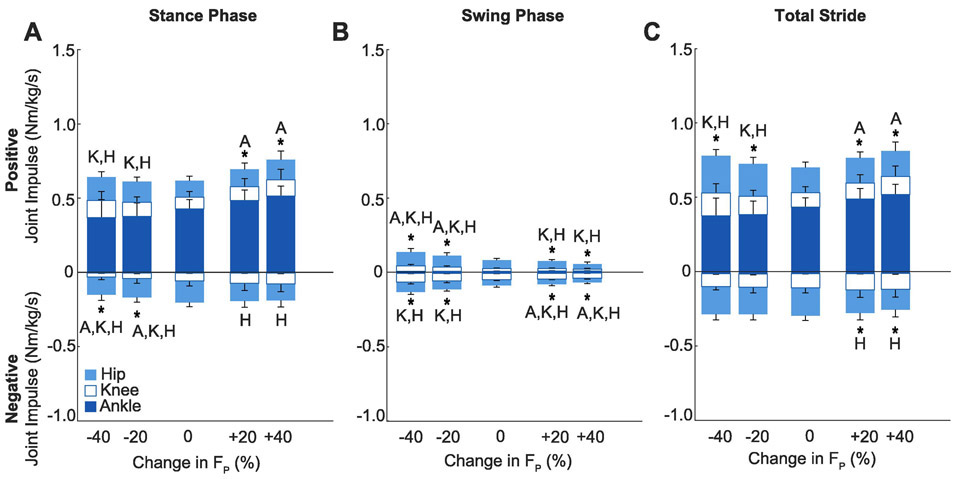
Figure 4.
Group average (standard deviation) positive and negative joint angular impulse. Conditions included biofeedback trials at targeted −40%, −20%, 0%, +20%, +40% peak trailing limb propulsion (FP). Letters represent a significant pairwise comparison from the normal walking condition (p<0.05) for ankle (A), knee (K), and hip (H). Asterisks (*) indicate a significant pairwise comparison for total (i.e., Ankle + Knee + Hip) angular impulse versus normal walking (p<0.05).

