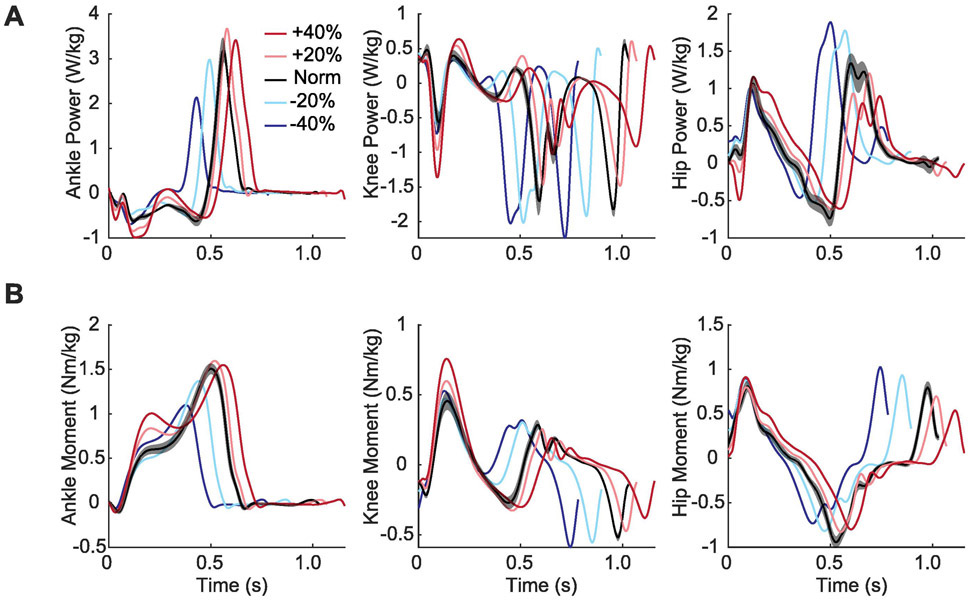
Figure 5.
Group average profiles for (A) joint power generation and (B) joint moments for each experimental condition plotted across an averaged gait cycle, from heel-strike to heel-strike. Conditions included biofeedback trials at targeted −40%, −20%, 0%, +20%, +40% peak trailing limb propulsion values in comparison to normal walking.

