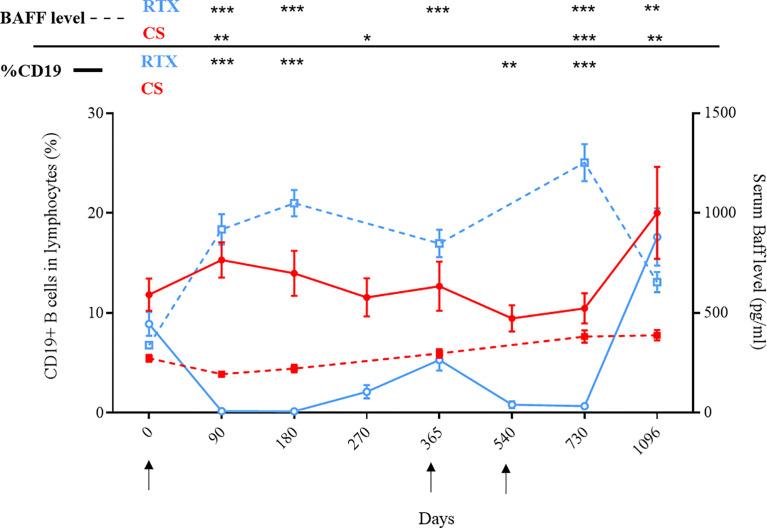
Figure 2.
Evolution of serum BAFF levels and CD19+ B cells according to treatments: rituximab (blue curves) or corticosteroids (red curves). Mean percentages of CD19+ B cells among peripheral blood lymphocytes were measured by flow cytometry and are indicated in full lines. Mean serum BAFF levels were measured by ELISA and are indicated in dashed lines. Arrows correspond to rituximab infusions. *p < 0.05; **p < 0.01; ***p < 0.001.

