Figure 3.
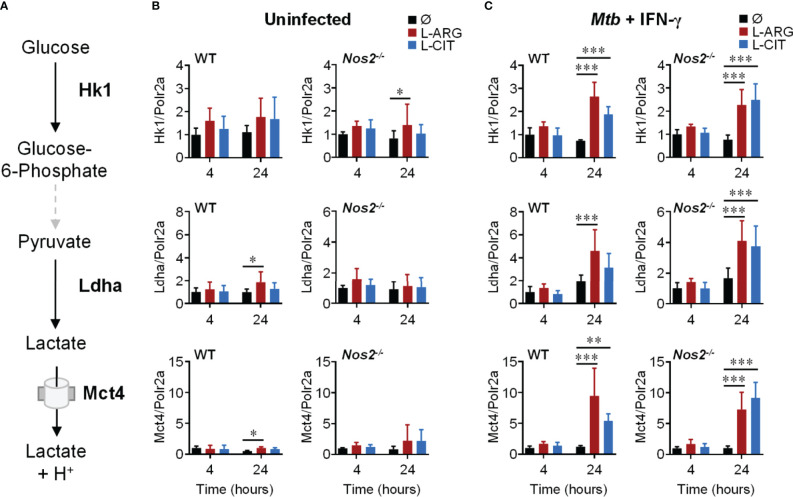
Transcriptional regulation of glycolysis genes by L-arginine/L-citrulline. (A) Schematic of glycolysis leading to lactate production and release from macrophages. (B, C) qRT-PCR analysis of uninfected PMΦs (B) or following Mtb H37Rv (MOI~1) infection and IFN-γ stimulation (C) from C57Bl/6 (WT) or Nos2-/- mice, cultured in R-free C-DMEM containing 400 μM L-arginine, L-citrulline, or neither amino acid (Ø). Gene expression is normalized to Polr2a. Data are the mean fold gene expression compared to 4 hour, neither amino acid data (N ≥ 5, two experiments combined). *p < 0.05, **p < 0.01, ***p < 0.001 by 2-way ANOVA with Sidak’s post hoc test. Error bars, SD.

