Figure 1.
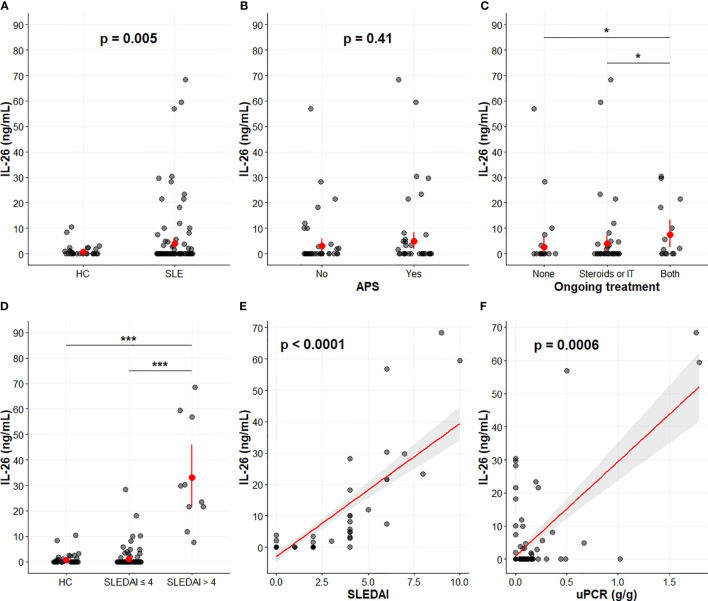
IL-26 levels in SLE. IL-26 levels according to SLE status (A), APS status (B), and ongoing treatment (C). Correlation between IL-26 levels and SLEDAI (D, E) or the urine protein to creatinine ratio (F). (A–D) In red, mean ± 95% confidence interval. (E, F) Graphs depict the linear regressions (red) with the 95% confidence intervals (grey). Spearman correlation coefficients (ρ) were 0.70 (p < 0.0001) between IL-26 and SLEDAI (E) and 0.32 (p = 0.0006) between IL-26 and uPCR (F). *p < 0.05. ***p < 0.001. APS, antiphospholipid syndrome; HC, healthy controls; IT, immunosuppressive therapy; SLE, systemic lupus erythematosus; SLEDAI, systemic lupus erythematosus disease activity index; uPCR, urine protein to creatinine ratio.

