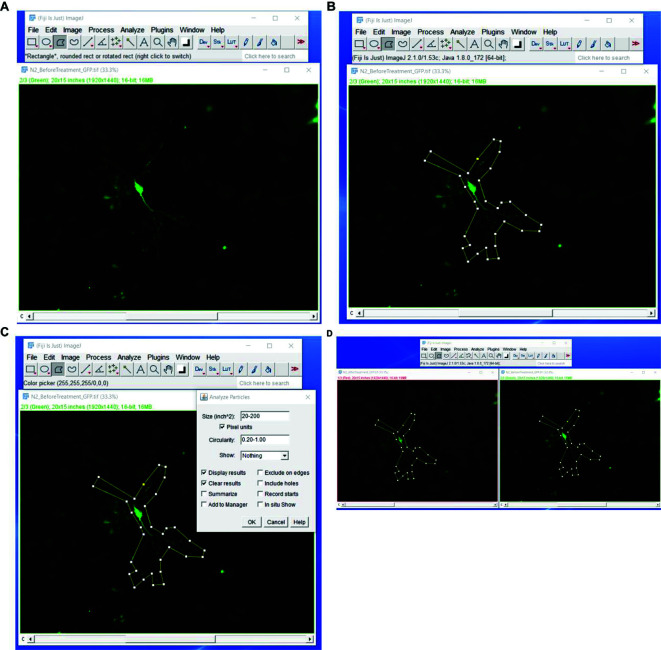
Figure 6. Fiji steps to measure actin/cofilin rod formation.
Upload the pre-light treatment image to Fiji (A). Use the polygon out tool to cover the area of the neuron to be measured (B). Select Analyze > Analyze Particles on the Fiji control panel. Select a size of 20-200 pixel units and restrict the circularity to 0.20-1.00 (C) and press OK to analyze. With the original pre-light treatment image with the polygon still outlining it, open the post-light treatment neuron image. With the post-light treatment neuron selected press Shift > E; this will transfer the polygon made in the pre-light treatment step. Align this over the same area in the post-light treatment step (D). Then re-analyze the post-light treatment using the same steps from C.

