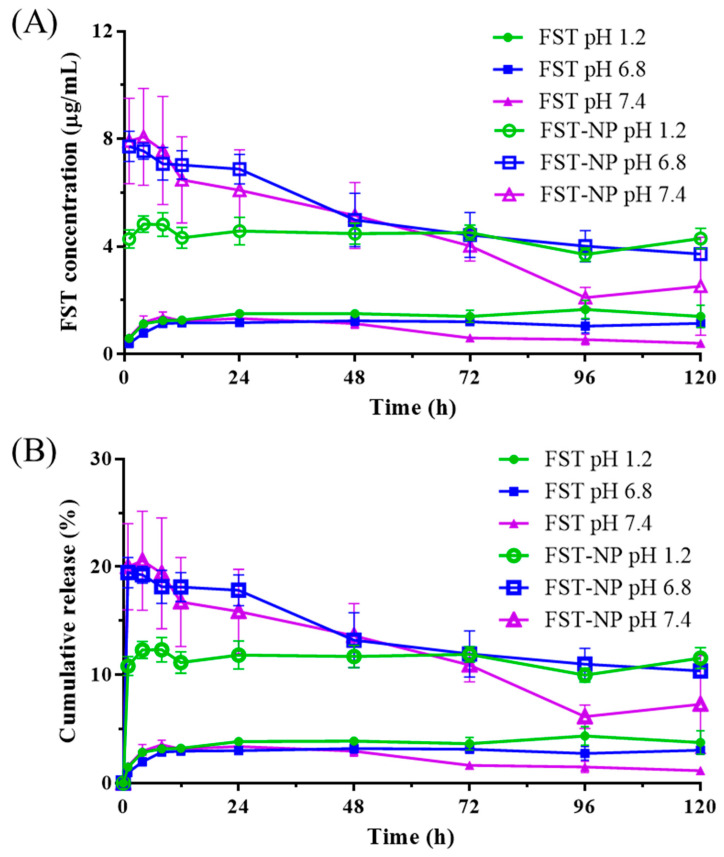
Figure 8.
The in vitro release profile of FST and FST–NP in the pH 1.2, 6.8, and 7.4 medium by presenting (A) concentration and (B) percentage of cumulative release. Data are expressed as mean ± standard deviation (n = 3). Green solid and hollow circle present FST and FST–NP in pH 1.2, blue solid and hollow square present FST and FST–NP in pH 6.8, and purple solid and hollow triangle present FST and FST–NP in pH 7.4.

