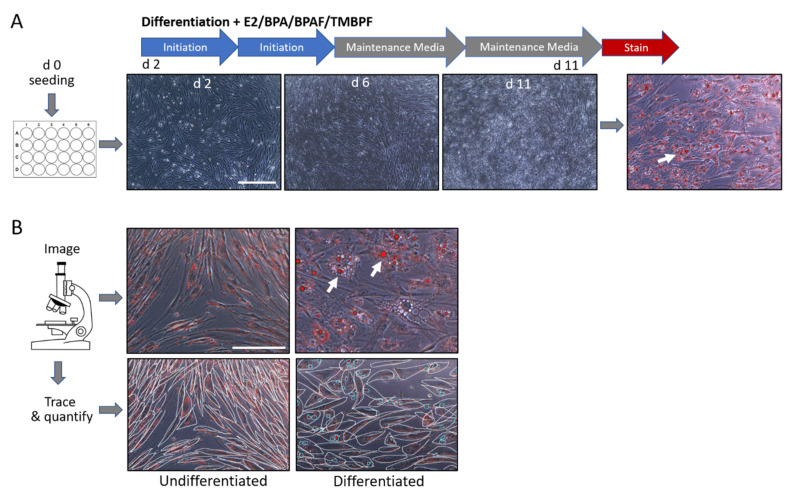
Figure 3.
Timeline and quantification of the differentiation process of human ASCs into adipocytes. (A) Brightfield images of stem cells treated with cycles of initiation media and maintenance media. All cells were fixed, stained with Oil Red-O, imaged, and quantified for lipid vacuoles (white arrows). (B) Representative images of undifferentiated (left) and differentiated (right) cells after staining with Oil Red-O. Tracing of cells and lipid vacuoles in undifferentiated (bottom left) and differentiated (bottom right) cell populations allowed quantification of adipogenesis. Clear morphology changes occur in the differentiated cells compared to undifferentiated controls, as indicated by the round cell shape and lipid vacuoles (arrows in top image and circles in bottom image; 200× magnification; scale bar = 150 μM).

