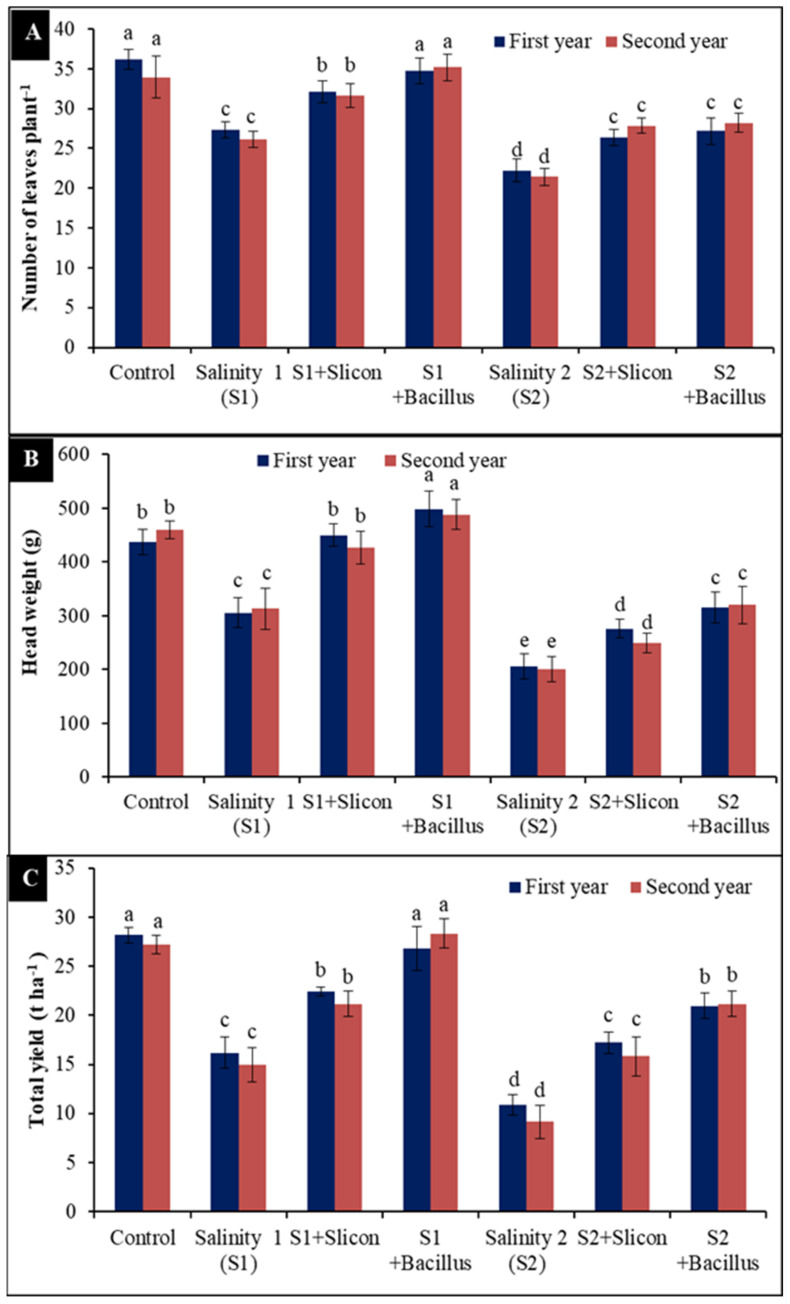
Figure 6.
Effect of Si (potassium silicate at 2.7 mmol L−1) and B. thuringiensis on leaves number (A) head weight (B) and total yield (C) in lettuce plants under salinity during two seasons (2019/2020 and 2020/2021). Different letters on the columns show significant differences between the treatments according to ANOVA, Duncan’s multiple range test at 0.05 level. Data is the mean (±SE) of tree replicates. Salinity 1 (S1): 4 dS m−1, Salinity 2 (S2): 8 dS m−1.

