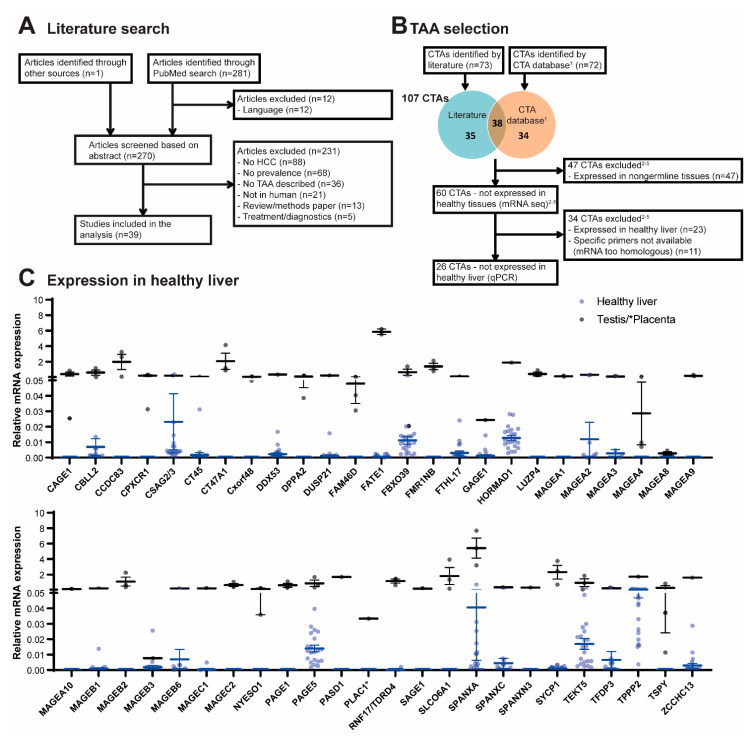
Figure 1.
Selection of CTAs. (A,B) Study Flow Diagram. (C) Relative mRNA expression of selected CTAs in healthy donor livers (n = 21) in blue and in the respective positive control tissues in black. Control tissues were: placenta (for PLAC1; n = 1) or testis (all other CTAs; n = 1–3). 1 http://www.cta.lncc.br/, accessed on 4 October 2018, 2 Hofmann, et al. 3 FANTOM consortium, 4 HPA consortium, 5 GTEx consortium [9,14,15].

