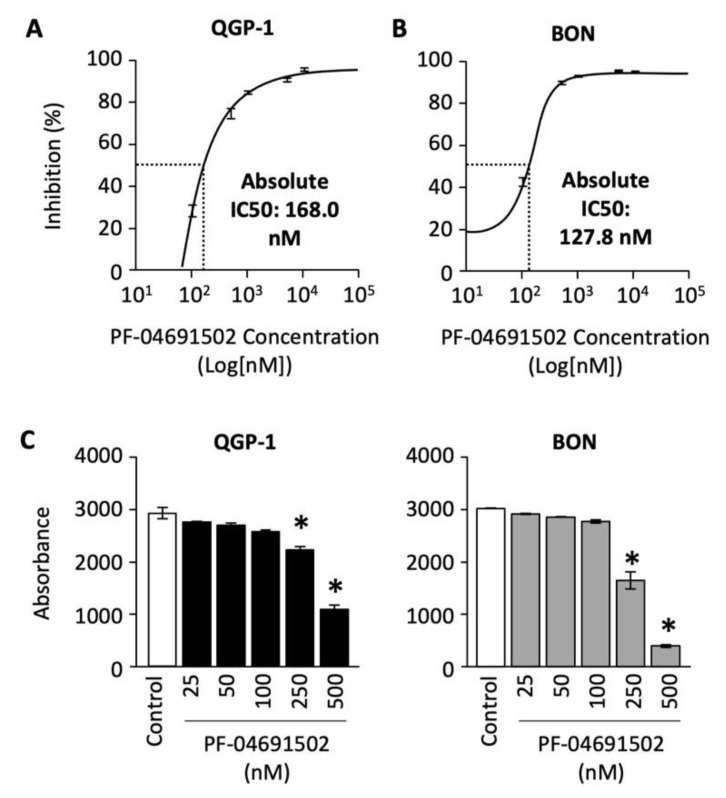
Figure 3.
Analysis of QGP-1 and BON cells’ proliferation and cell survival after PF-04691502 treatment. (A) QGP-1 and (B) BON cells were seeded in 96-well plates at 5000 cells/100 µL density (n = 6 per group) and treated with PF-04691502 from 100 to 10,000 nM for 72, 96, and 120 h. Cell proliferation was analyzed with SRB assay as described. Percentage inhibition of proliferation was plotted against concentrations of PF-04691502 on a logarithmic scale. Absolute IC-50 was denoted by a dashed line and labeled, respectively. (C) QGP-1 and BON cells were seeded in a 96-well plate at 200 cells/100 µL density (n = 6 per group) and treated with PF-04691502 from 25 to 500 nM. Cells were fixed and stained according to SRB protocol 14 d later. *, p < 0.01 versus control colorimetric cell survival by one-way ANOVA analysis.

