Figure 8.
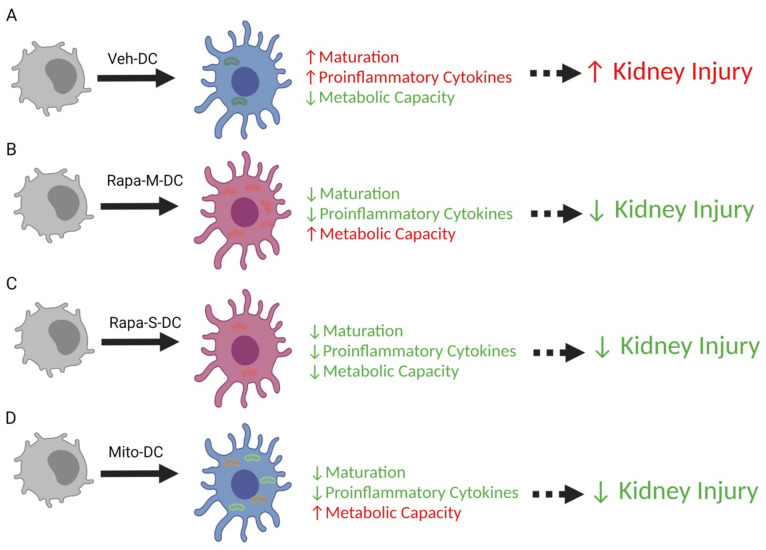
Model summarizing the change in bone marrow dendritic cells conditioned with rapamycin or treated with exogenous mitochondria protect kidneys from ischemic reperfusion injury. (A) Dendritic cells propagated for 8 days in GMCSF have higher maturation (MHCII, CD40, CD80, CD86) and pro-inflammatory cytokines (TNFα, IL1β, IL12p40, IL6) and lower metabolic capacity (mitochondrial oxygen consumption rate) after overnight treatment with 100 ng/mL LPS stimulation. Systemic transfer of 0.5 × 10⁶ DCs one day before bilateral kidney IRI results in higher kidney injury. (B) Dendritic cells propagated for 8 days in GMCSF and three treatments with rapamycin have lower maturation (MHCII, CD40, CD80, CD86) and proinflammatory cytokines (TNFα, IL1β, IL12p40, IL6) and higher metabolic capacity (mitochondrial oxygen consumption rate) after overnight treatment with 100 ng/mL LPS stimulation. Systemic transfer of 0.5 × 10⁶ DCs one day before bilateral kidney IRI results in lower kidney injury compared to mice treated with PBS or Veh-DC (A). (C) Dendritic cells propagated for 8 days in GMCSF and 1 overnight treatment with rapamycin have lower maturation (MHCII, CD40, CD80, CD86) and proinflammatory cytokines (TNFα, IL1β, IL12p40, IL6) and lower metabolic capacity (mitochondrial oxygen consumption rate) after overnight treatment with 100 ng/mL LPS stimulation. Systemic transfer of 0.5 × 10⁶ DCs one day before bilateral kidney IRI results in lower kidney injury compared to mice treated with PBS or Veh-DC (A). (D) Dendritic cells propagated for 8 days in GMCSF and one overnight treatment with exogenous mitochondria have lower maturation (MHCII, CD40, CD80, CD86) and proinflammatory cytokines (TNFα, IL1β, IL12p40, IL6) and higher metabolic capacity (mitochondrial oxygen consumption rate) after overnight treatment with 100 ng/mL LPS stimulation. Systemic transfer of 0.5 × 10⁶ DCs one day before bilateral kidney IRI results in lower kidney injury compared to mice treated with PBS or Veh-DC (A). The figure was created by the authors with BioRender.com.

