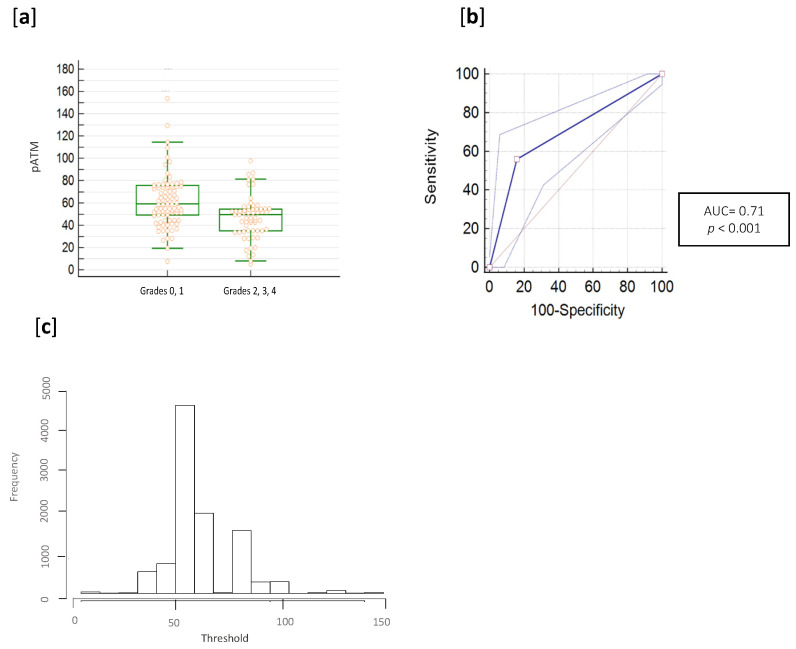
Figure 1.
Determination of the optimized threshold and prediction results of the 150 patients. (a) pATM ELISA assay distribution (pATM quantities are in ng/mL). (b) ROC analysis was performed on pATM ELISA results and a Wilcoxon rank sum test was also applied to compare RR and RS groups (p < 0.001). (c) Histogram of threshold frequencies after the bootstrap analysis.

