. 2021 May 13;10(5):e28684. doi: 10.2196/28684
©Sheri J Hartman, Lindsay W Dillon, Andrea Z LaCroix, Loki Natarajan, Dorothy D Sears, Neville Owen, David W Dunstan, James F Sallis, Simon Schenk, Matthew Allison, Michelle Takemoto, Alexandra M Herweck, Bao Nguyen, Dori E Rosenberg. Originally published in JMIR Research Protocols (https://www.researchprotocols.org), 13.05.2021.
This is an open-access article distributed under the terms of the Creative Commons Attribution License (https://creativecommons.org/licenses/by/4.0/), which permits unrestricted use, distribution, and reproduction in any medium, provided the original work, first published in JMIR Research Protocols, is properly cited. The complete bibliographic information, a link to the original publication on https://www.researchprotocols.org, as well as this copyright and license information must be included.
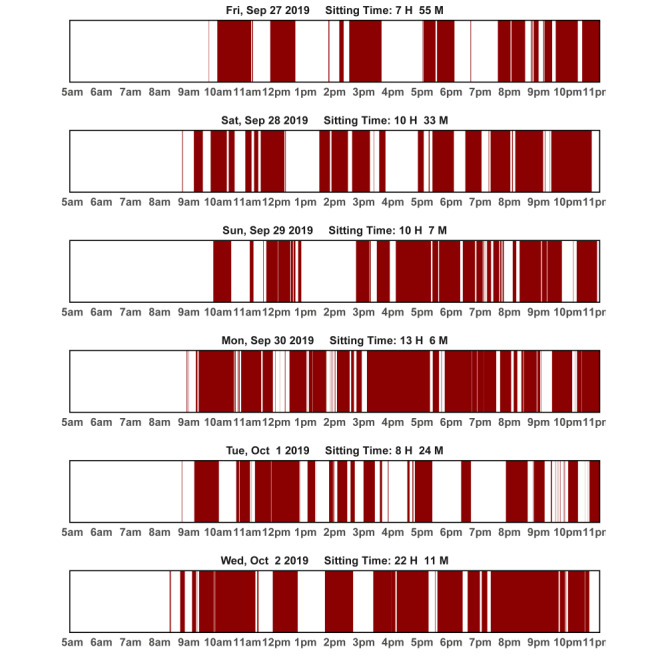
Figure 1.

Sample feedback graph for the Reduce Sitting group: day-level activPAL data; red indicates where sitting occurred.
