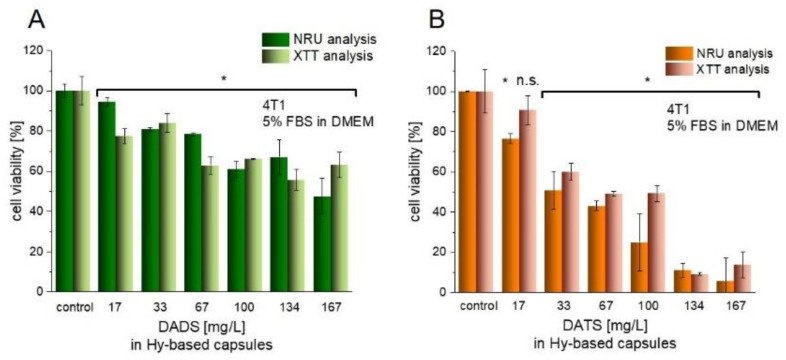
Figure 7.
Cell viability (analyzed by neutral red uptake (NRU) and XTT assays) after the treatment of Hy-based capsules with DADS (A) and DATS (B). The data shown as mean +/− SD, (n = 3) represents the amount of encapsulated and delivered compounds. The aqueous and oil phase were mixed in 1000:3 volume ratio. Significance estimated with the Mann–Whitney U-test in relation to the respective control groups; * p < 0.05; n.s., not significant.

