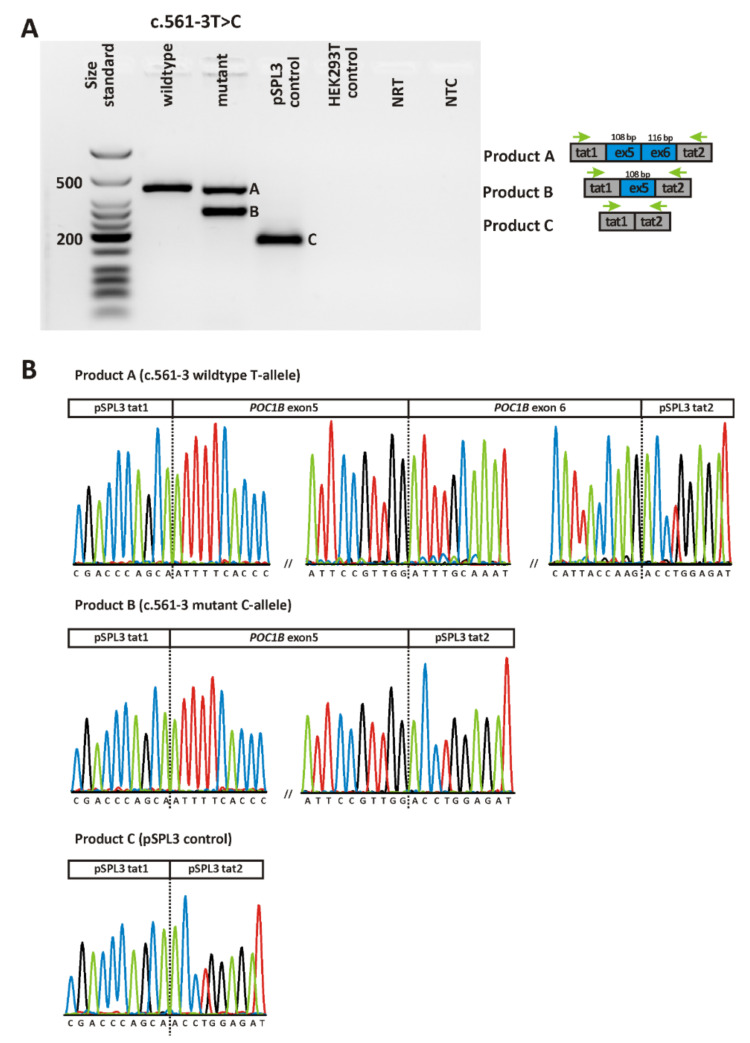
Figure 4.
In vitro splicing assay for variant c.561-3T>C. (A) Agarose gel electrophoresis of RT-PCR products. Gel loading is as follows: A size standard (low molecular weight DNA ladder, NEB) is loaded in the leftmost lane. The RT-PCR product derived from HEK293T cells transfected with a plasmid construct harboring the wildtype allele is shown in lane 2, while the RT-PCR products obtained upon transfection with the mutant allele are shown in lane 3. RT-PCRs from transfection with empty pSPL3 vector (lane 4) and untransfected HEK293T cells (lane 5) served as controls. NRT (lane 6), no reverse transcriptase control; NTC (lane 7), no template control. Schemes of the amplified products are presented next to the agarose gel picture. Grey boxes represent pSPL3 resident exons tat1 and tat2, and blue boxes POC1B exons, respectively. The green arrows indicate the location of the RT-PCR primers. (B) Sequencing analysis of RT-PCR products. Sequencing analysis shows that the single RT-PCR product derived from transfection with the wildtype minigene construct corresponds to correct splicing (i.e., splicing of POC1B exons 5 and 6 between the pSPL3 resident exons tat1 and tat2), while the smaller transcript expressed by cells transfected with the mutant minigene construct shows skipping of exon 6. The bigger transcript corresponds to correct splicing (not depicted). Sequence analysis of the single RT-PCR product obtained from cells transfected with the “empty” pSPL3 plasmid shows that the two resident exons of the pSPL3 vector (i.e., tat1 and tat2) are spliced together.

