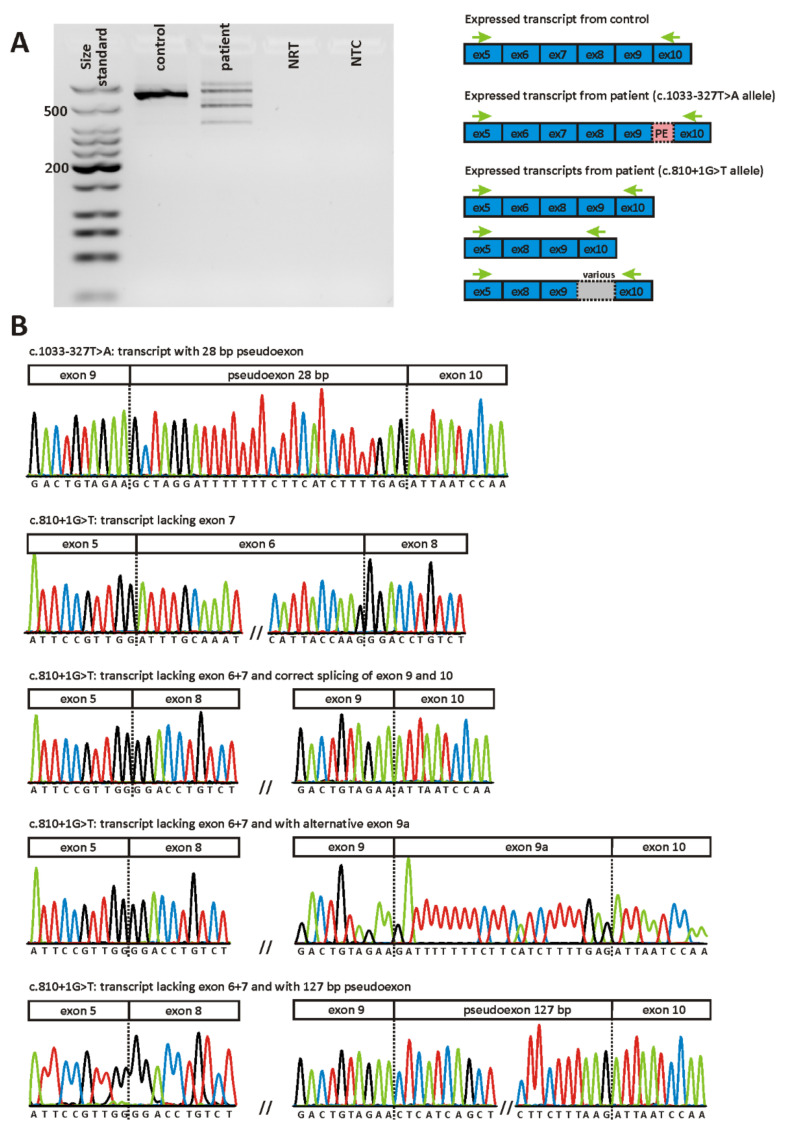
Figure 6.
Direct transcript analysis in patient MDS438 from blood. (A) Agarose gel electrophoresis of RT-PCR products. Gel loading is as follows: A size standard (low molecular weight DNA ladder, NEB) is loaded in the leftmost lane. RT-PCR products derived from a healthy control person are shown in lane 2, while those from the patient are shown in lane 3. NRT (lane 4), no reverse transcriptase control; NTC (lane 5), no template control. Schemes of the amplified products are presented next to the agarose gel picture. (B) Sequencing of patient´s RT-PCR products following subcloning. Only relevant junctions are shown. Three major transcripts could be identified: Transcripts expressed by the c.1033-327T>A allele with a pseudoexon of 28 bp spliced between exon 9 and exon 10 and transcripts expressed by the c.810+1G>T allele lacking either exon 7 or both exon 6 and 7. In addition, some transcripts lacking both exon 6 and 7 showed additional aberrant splicing between exon 9 and 10: inclusion of the 28 bp pseudoexon (not depicted), inclusion of the alternative exon 9a or inclusion of a 127 bp pseudoexon.

